Original Data
| Rev Diabet Stud,
2013,
10(4):270-282 |
DOI 10.1900/RDS.2013.10.270 |
Polyphenol-Rich Bilberry Ameliorates Total Cholesterol and LDL-Cholesterol when Implemented in the Diet of Zucker Diabetic Fatty Rats
Lea Brader1, Ann Overgaard1, Lars P. Christensen2, Per B. Jeppesen1, Kjeld Hermansen1
1Department of Endocrinology and Internal Medicine, Aarhus University Hospital, Aarhus C, Denmark
2Department of Chemical Engineering, Biotechnology and Environmental Technology, Faculty of Engineering, University of Southern Denmark, Odense, Denmark
Address correspondence to: Lea Brader, Department of Endocrinology and Internal Medicine, Aarhus University Hospital, Tage-Hansens Gade 2, 8000 Aarhus C, Denmark, e-mail: brader.lea@gmail.com
Manuscript submitted November 10, 2013; resubmitted December 10, 2013; accepted December 22, 2013.
Keywords: bilberry, blackcurrant, anthocyanins, cholesterol, insulin sensitivity, blood pressure, type 2 diabetes, obesity
Abstract
BACKGROUND: Bilberries and blackcurrants are nutrient sources rich in bioactive components, including dietary fibers, polyphenols, and anthocyanins, which possess potent cardiovascular protective properties. Few studies investigating the cardio-protective effects of natural components have focused on whole bilberries or blackcurrants. OBJECTIVE: The aim of this trial was to investigate whether a diet enriched with bilberries or blackcurrants has beneficial effects on glucose metabolism, lipid profile, blood pressure, and expression of genes related to glucose and lipid metabolism. METHODS: Male Zucker Diabetic Fatty (ZDF) rats (n = 48) were randomly assigned to either a control, bilberry-enriched, blackcurrant-enriched, or fiber-enriched diet for 8 weeks ad libitum. Real-time quantitative PCR analysis was performed on liver, adipose, and muscle tissue. Berry polyphenol content was determined by HPLC and LC-MS analysis. RESULTS: Bilberry enrichment reduced total (-21%, p = 0.0132) and LDL-cholesterol (-60%, p = 0.0229) levels, but increased HDL-cholesterol to a lesser extent than in controls. This may partly be due to the altered hepatic liver X receptor-α expression (-24%, p < 0.001). Neither bilberries nor blackcurrants influenced glucose metabolism or blood pressure. Nevertheless, transcriptional analysis implied a better conservation of hepatic and adipocyte insulin sensitivity by bilberry enrichment. Anthocyanins constituted 91% and 87% of total polyphenol content in bilberries and blackcurrants, respectively. However, total anthocyanin content (3441 mg/100 g) was 4-fold higher in bilberries than in blackcurrants (871 mg/100 g). CONCLUSIONS: Bilberry consumption ameliorated total and LDL-cholesterol levels, but not HDL-cholesterol levels in ZDF rats. Neither bilberry nor blackcurrant enrichment delayed the development of diabetes or hypertension. Thus, in rats, bilberries may be valuable as a dietary preventive agent against hypercholesterolemia, probably by virtue of their high anthocyanin content.
Abbreviations: Adipor1 - adiponectin receptor 1; Akt2 - serine/threonine-protein kinase 2; ANOVA - analysis of variance; CV - capillary voltage; CVD - cardiovascular disease; FABP4 - fatty acid binding protein 4; FFA - free fatty acids; GFAT - glutamine fructose-6-phosphate aminotransferase; GLUT - glucose transporter; HbA1c - glycosylated hemoglobin; HDL - high density lipoprotein; HOMA-β - homeostasis model assessment of β-cell function; HOMA-IR, homeostasis model assessment of insulin resistance; HPLC - high-performance liquid chromatography; iAUC - incremental area under the curve; InsR - insulin receptor; IRS - insulin receptor substrate; JNK-1 - c-Jun N-terminal protein kinase; LC-PDA-APCI-MS/MS - liquid chromatography-photodiode array-atmospheric pressure chemical ionization-tandem mass spectrometry; LDL - low density lipoprotein; LPL - lipoprotein lipase; LXR-α - liver X receptor-α; OGTT - oral glucose tolerance test; Pi3K - phosphoinositide 3-kinase; SREBP - sterol regulatory element-binding protein; T2D - type 2 diabetes; TL - tube lens; ZDF - Zucker Diabetic Fatty
Introduction
Central obesity and metabolic diseases such as insulin resistance, dyslipidemia, low-grade chronic inflammation, endothelial dysfunction, and hypertension are all conditions that commonly precede the development of type 2 diabetes (T2D) and cardiovascular disease (CVD). CVD remains one of the leading causes of death, and is therefore a primary focus of research and treatment [1]. Fortunately, several CVD risk factors are preventable and treatable.
Mounting evidence from epidemiological studies indicates that the consumption of diets rich in fruits and vegetables is associated with an improved cardiovascular risk profile [2]. Several components of fruit and vegetables may exert cardio-protective effects, including dietary fibers, micronutrients, and polyphenols [3, 4]. Anthocyanins and flavonols constitute a subclass of polyphenols that possesses a wide range of potent disease-protective properties [5]. Bilberries (vaccinuim myrtillus) and blackcurrants (ribes nigrum) are food sources that are particularly rich in bioavailable anthocyanins and flavonols [6, 7]. Moreover, the relative antioxidant activity of anthocyanins and flavonols in bilberries and blackcurrants is especially high [8] and several studies have demonstrated beneficial effects of these berries on antioxidant status and low-grade inflammation [9-12].
Although several studies have investigated the CVD-related effects of anthocyanins and anthocyanin-rich berry extracts or juices, only few studies have focused on the effects of whole bilberries or blackcurrants per se. In subjects with increased CVD risk, consumption of bilberries and blackcurrants (100 g/day) together with juice/nectar from other berries (approximately 50 g/day) for 8 weeks resulted in favorable changes in platelet function, HDL-cholesterol, and blood pressure [13]. An extract of mixed anthocyanins from bilberries and blackcurrants given to dyslipidemic Chinese subjects for 12 weeks improved LDL- and HDL-cholesterol [14]. In animal studies, anthocyanin-rich bilberry extracts have been shown to ameliorate atherosclerosis in Apo-E deficient mice [15], and hyperglycemia and insulin sensitivity in diabetic mice [16].
The primary aim of this study was to investigate whether a diet rich in bilberries or blackcurrants has favorable effects on glucose metabolism and is able to delay the progression to T2D in Zucker Diabetic Fatty (ZDF) rats. Concomitantly, we examined the effects on lipid profile and blood pressure. In addition, the underlying mechanisms of action were explored by focusing on the expression of genes related to glucose and lipid metabolism in insulin-sensitive tissues.
Materials and methods
Animals and experimental design
Forty-eight male ZDF (Crl-Leprfa) rats were obtained from Charles River Laboratories in Germany. The homozygous recessive ZDF rat is an experimental inbred model that mimics the metabolic abnormalities of T2D and its cardiovascular complications, including dyslipidemia [17]. When fed a high-carbohydrate diet, T2D develops at approximately 12 weeks of age [18]. The animals were caged individually in enclosed ventilated cabinets controlled for temperature (22 °C), relative humidity (50%), and light conditions (12 hour light/dark cycles). Before entering the experiment, animals were acclimated for 5 days and fed a standard chow diet ad libitum (Altromin 1324, Brogaarden, Denmark).
At 7 weeks of age, the animals were randomly divided into 4 different diet groups (n = 12/group), and then observed for 8 weeks. At baseline, an oral glucose tolerance test (OGTT) was performed, and overnight-fasting blood samples for biochemical analysis were obtained. Blood samples were collected from the tip of the tail in chilled tubes containing heparin/aprotinin. Subsequently, the samples were centrifuged. Plasma was frozen for analysis of fasting insulin, glucose, triacylglycerol, free fatty acids (FFA), total cholesterol, and LDL- and HDL-cholesterol levels. Whole blood was collected in tubes with tripotassium EDTA and frozen afterwards for the determination of glycosylated hemoglobin (HbA1c).
Body weight, 24-hour food intake, and whole blood glucose collection after overnight-fasting were measured weekly throughout the experiment. At 15 weeks of age, blood pressure and heart rate were measured. OGTT was performed on different days. On the third day, the overnight-fasted animals were anesthetized by intraperitoneal injection with a lethal dose of sodium pentobarbital, and blood was collected by retro-orbital puncture. This final sample was also analyzed for FFA. The animals were terminated by cervical dislocation. A midline laparotomy was performed, and liver, soleus muscle, and abdominal adipose tissue were dissected and snap-frozen in liquid nitrogen for subsequent analysis of real-time quantitative polymerase chain reaction (RT-PCR) and hepatic triacylglycerol. The experiments were performed in accordance with the local guidelines, and approved by the Danish Animal Experiments Inspectorate (No. 2010/561-1805).
Experimental diets
The animals were randomly divided into 4 groups fed the following experimental diets ad libitum:
1. Control diet, consisting of a standard chow laboratory animal diet (Altromin 1324, Brogaarden, Denmark).
2. Bilberry diet, with 15% of the standard chow substituted with bilberries.
3. Blackcurrant diet, with 15% of the standard chow substituted with blackcurrants.
4. Fiber diet.
To incorporate the berries into pellets, bilberries and blackcurrants were applied as a whole-berry product powder (Joswola Oy, Iisalmi, Finland). Fresh whole berries originating from Finland were gently dried to remove the water fraction in a single drying process at approximately 30°C to reduce the loss of nutrients, and were then ground into powder. The mean food intake was 33 g per day in both berry groups. Hence, the 15% berry enrichment corresponded to 5 g of berry powder per day ingested by each animal on average (equaling 25 g of fresh berry).
Macronutrient composition and dietary fiber content of the berry powders were analyzed using the specific Nordic Committee on Food Analysis. The powders were subsequently mixed with standard chow into pellets by Altromin Spezialfutter (GmbH, Lage, Germany). The fiber group was fed standard chow with the addition of cellulose and pectin prepared by Altromin Spezialfutter (GmbH, Lage, Germany), mimicking the fiber content of the berry diets, i.e., 9% crude fiber. The energy and nutrient composition of the experimental diets is presented in Table 1.
Table
1.
Energy and crude macronutrient composition of the experimental diets (unit/100 g) fed ad libitum to Zucker Diabetic Fatty rats for 8 weeks |
|
 |
 |
Legend:
Values are means. |
|
Extraction and analysis of polyphenols
Berry powder (2.5 g) was extracted with 15 ml methanol:water:trifluoroacetic acid (70:30:1, v/v/v) for 16 h under constant stirring at 22°C in the dark. The extracts were then filtered and collected in a 50 ml volumetric flask. The resulting filter cake was re-extracted with 15 ml extraction solvent. The volume of the combined extract was adjusted to a final volume of 50 ml by 70% aqueous methanol and stored at 5°C until analysis. The combined extracts were filtered (Whatman Puradisc 13 syringe filters 0.2 μm, Sigma-Aldrich, Steinheim, Germany) and put into high-performance liquid chromatography (HPLC) vials before analysis. The extraction procedure resulted in the extraction of > 95% of all polyphenols, as shown by separate successive extraction experiments (data not shown). All extractions were made in three replicates.
An Agilent 1100 series HPLC system (Agilent Technologies, Waldbronn, Germany) equipped with a photodiode array detector was used for HPLC analysis. Separations of polyphenols were performed on a Luna C18(2) 100 Å, end-capped (particle size 5 μm; 150 mm x 4.6 mm ID) reversed-phase column (Phenomenex, Allerød, Denmark). The mobile phase consisted of 0.5% trifluoroacetic acid in water (solvent A) and 100% acetonitrile (solvent B). The following gradient was used: 0 min (7% B), 60 min (30% B), 65 min (50% B), and 70 min (7% B). The column temperature was 25°C, the flow rate was 1 ml/min, the injection volume was 10 μl, and the photodiode array detector was operated at 280 and 320 nm for phenolic acids, 350 nm for flavonols, and 520 nm for anthocyanins. Phenolic acids, flavonols, and anthocyanins were quantified according to a calibration curve of authentic standards of chlorogenic acid (0.007-1.41 mg/ml), quercetin-3-O-glucoside (0.002-0.47 mg/ml), and cyanidin-3-O-rutinoside (0.014-1.40 mg/ml), respectively.
Furthermore, the molecular weight of the individual polyphenols was included in the calculations of their concentrations, taking into account their different molecular weights compared with the external standards. Unidentified polyphenols were classified as anthocyanins, flavonols, or phenolic acids based on their UV spectra and their quantification was based only on calibration curves.
Polyphenols were identified by liquid chromatography-photodiode array-atmospheric pressure chemical ionization-tandem mass spectrometry (LC-PDA-APCI-MS/MS) [19, 20]. LC-MS data was obtained on a LTQ XL mass spectrometer (Linear Quadrupole 2D Ion Trap, LTQ20992, Thermo Scientific, San Jose, CA, USA) operated in APCI negative mode. Compounds were monitored at 280, 320, 350, and 520 nm and UV spectra were recorded between 200 and 600 nm. Settings for the mass spectrometer were 50, 20, and 5 (arbitrary units) for sheath, auxiliary, and sweep gas flow rates, respectively, with a vaporizer temperature of 450°C, a discharge current of 5 µA, and a capillary temperature of 275°C. The settings for the capillary voltage (CV) and tube lens (TL) were as follows:
- Anthocyanins: CV of -9 V, TL of -85 V
- Flavonols: CV of -5 V, TL of -80 V
- Phenolic acids: CV of -9 V, TL of -45 V
Automatic gain control target settings were 3 × 10⁴ and 1 × 10⁴ for full MS and MS/MS, respectively. Separations were performed at the same chromatographic conditions as described above for the HPLC analysis.
Biochemical analyses
Fasting glucose, HbA1c, FFA, triacylglycerol, total cholesterol, and LDL- and HDL-cholesterol, obtained at baseline and at the end of the experiment, were determined by a fully automatic Cobas c 111 analyzer (Roche Diagnostics GmbH, Mannheim, Germany) using colorimetric methods with specific kits. The Roche GLUC2 kit was used for plasma glucose, the Roche A1c-2 kit including a hemolysate application was used for whole blood HbA1c and a Wako NEFA-HR2 kit (Wako Chemicals GmbH, Neuss, Germany) was applied for plasma FFA. The Roche CHOL2, LDLC, HDLC3, and TRIGL kits were used for the analysis of plasma total cholesterol, LDL- and HDL-cholesterol, and triacylglycerol plus hepatic triacylglycerol, respectively. Plasma insulin was determined by radioimmunoassay (RIA) using a sensitive rat insulin RIA kit (Linco Research Inc., St Charles, Missouri, USA). All analytic procedures were performed in accordance with the manufacturers’ instructions. The weekly measurements of fasting whole blood glucose were determined by a OneTouch glucose monitoring apparatus (Precision Xceed, Abbott Laboratories A/S, Denmark).
Oral glucose tolerance test
Animals were fasted overnight (water ad libitum) before the OGTT and were given a glucose load of 2.0 g D-glucose/kg body weight as a 60% glucose solution by gavage. Blood samples were drawn 15 minutes and immediately before the glucose load and after the gavage at 30, 60, 90, 120, 180, and 240 minutes. Whole blood glucose was measured from the tip of the tail with a OneTouch glucose monitoring apparatus (Precision Xceed, Abbott Laboratories A/S, Denmark).
Blood pressure measurements
At the end of the experiments, systolic blood pressure and heart rate were measured in conscious, unanesthetized animals by a noninvasive tail-cuff method using an automatic computer-assisted opto-electronic pulse transducer (209000, TSE Systems GmbH, Bad Homburg, Germany). During the measurements, the animal was held in a restrainer under calm conditions. Prior to the measurements, the animals had been accustomed to the restrainer and to wearing the tail-cuff. To achieve adequate blood flow, the tail of the animals was warmed slightly using an infra-red heat lamp.
RNA isolation and real-time quantitative PCR
RNA was purified from homogenized liver, muscle, and adipose tissue samples by a QIAcube (Qiagen, Copenhagen, Denmark) using tissue-specific RNeasy minikits (Qiagen, Copenhagen, Denmark) according to the manufacturer’s instructions. To examine RNA quantity and quality, optical density absorbance measurements at 260 and 280 nm (NanoDrop ND-8000 UV-Vis Spectrophotometer, NanoDrop Technologies, Wilmington, Germany) and gel electrophoresis of the endogenous controls using a 1% agarose gel electrophoresis stained with SYBR green were performed. An iScribtTM cDNA synthesis kit (Bio-Rad, Hercules, CA, USA) was used to reverse transcribe the purified RNA to cDNA.
Real-time quantitative PCR was performed by the outsourcing company Aros Applied Biotechnology A/S (Skejby, Denmark) using the Fluidigm BioMark system (Fluidigm 96.96 Dynamic, Fluidigm Cat. No. BMK-M-96.96). Gene expression was analyzed using rat-specific TaqMan assays predesigned by Applied Biosystems with the following assay ID numbers:
- Rn00581185_m1: liver X receptor-α (LXRα)
- Rn01495769_m1: sterol regulatory element-binding protein-1c (SREBP1c)
- Rn01502638_m1: SREBP2
- Rn00670361_m1: fatty acid binding protein 4 (FABP4)
- Rn00561482_m1: lipoprotein lipase (LPL)
- Rn00595250_m1: adiponectin
- Rn01483784_m1: adiponectin receptor 1 (Adipor1)
- Rn00563565_m1: glucose transporter 2 (GLUT2)
- Rn00562597_m1: GLUT4
- Rn02132493_s1: insulin receptor substrate-1 (IRS1)
- Rn01637243_m1: insulin receptor (InsR)
- Rn00564547_m1: phosphoinositide 3-kinase (Pi3K)
- Rn00690901_m1: serine/threonine-protein kinase 2 (Akt2)
- Rn01473307_m1: c-Jun N-terminal protein kinase (JNK-1)
- Rn01765492_m1: glutamine fructose-6-phosphate aminotransferase (GFAT)
Two rat-specific assays (S18: ABI, Hs99999901_s1 and Hprt1: ABI, Rn01527840_m1) were used as endogenous controls. The setup was performed in accordance with the manufacturer’s protocol in triplicates. One hundred nanograms of RNA were used as input in 20-µl reverse transcript reactions. The reverse transcription was performed using the high capacity cDNA reverse transcription kit (ABI, PN4368813) in accordance with manufacturer's protocol.
After reverse transcription, the cDNA samples were amplified using Fluidigm Specific Target Amplification. Briefly, the cDNA was amplified using a target-specific assay (diluted 1:100) and TaqMan PreAmp master mix (2X) (ABI, PN 4391128) in a 14 cycle thermal cycler reaction: 10 min at 95°C and 14 cycles of 15 sec at 95°C and 4 min at 60°C. Amplification was performed using the standard conditions: 2 min at 50°C, 10 min at 95°C and 40 cycles of 15 sec at 95°C and 1 min at 60°C. Relative quantification of gene expression was performed using the 2-ΔΔCT (comparative CT) method [21] to determine the relative expression.
Statistical analysis and calculations
Data analysis was performed using Stata statistical software (version 11.0; StataCorp LP, College Station, Texas, USA). The data are expressed as the mean ± SEM unless stated otherwise. One-way analysis of variance (ANOVA) followed by linear regression analysis was used to compare differences among group means. Both tests included baseline as covariable. Normal distribution and equal variances across groups were tested using quantile-quantile plots and Bartlett's test, respectively.
Whenever data were not normally distributed or when variances differed, data were logarithmically transformed. If the assumptions were still not met, the nonparametric Kruskal-Wallis test followed by Dunn's multiple comparisons test was applied. Time by treatment interactions for food intake, body weight and fasting whole blood glucose were analyzed using two-way repeated measures ANOVA. P < 0.05 was considered significant. At a statistical power of 80% (p < 0.05), the number of animals needed per group was 10 to detect a difference of 300 ± 130 mmol/l x 240 min (mean ± SD) on our primary effect parameter, the incremental area under the glucose curve (iAUC).
Glucose iAUC measurements obtained at the OGTT were calculated using the trapezoidal method [22]. The homeostasis model assessment equation was used to estimate insulin resistance (HOMA-IR) and β-cell function (HOMA-β) based on fasting plasma insulin and glucose measurements [23].
The expression levels of the target genes are presented as fold changes relative to the control group. False discovery rate correction [24] was used to address the problem of multiple statistical testing of gene expression to eliminate false positives. Consequently, only expression values with p-values below the calculated false discovery rate cut-off value are reported as significant.
Results
Of the 48 animals entering the experiment, one animal in the fiber group died during the OGTT procedure performed at the end of trial. Thus, data was obtained from only 11 animals for final biochemical analyses and gene expression in the relevant group.
Polyphenols in bilberry and blackcurrant powders
The content of major polyphenols in selected phenolic classes (anthocyanins, flavonols, and phenolic acids) of the berry powders used in the present study is presented in Table 2. Major polyphenols constituted approximately 98% of the total polyphenol content, of which anthocyanins constituted 91.2% and 87.3% of the total polyphenol content in bilberry and blackcurrant powder, respectively. However, bilberry powder contained 3441 mg anthocyanins/100 g, which was approximately 4 times greater than the content identified in the blackcurrant powder (871 mg anthocyanins/100 g).
Table
2.
Content of major polyphenols identified in the bilberry (vaccinium myrtillus) and blackcurrant (ribes nigrum) powder included in the experimental diets |
|
 |
|
Legend:
Data are means ± SD. a Identification based on Rt, UV-Vis and LC-MS data compared with data from the literature [19, 20]. b Content of phenols (mg/100 g powder). c Identified by comparison with an authentic standard. Abbreviations: HPLC - high-performance liquid chromatography. MS - mass spectroscopy. Rt - retention time (min) on HPLC. UV-Vis - ultraviolet and visible light spectroscopy. |
|
In total, 11 major anthocyanins were characterized and quantified in bilberries, including 3-O-arabinosides, 3-O-glucosides, and/or 3-O-galactosides of five anthocyanidins: cyanidin, delphinidin, malvidin, peonidin, and petunidin. In blackcurrants, only four major anthocyanins with aglycones of cyanidin and delphinidin were observed (Table 2). Flavonoids, i.e., flavonols, constituted only 2.2% and 7.9% of the total polyphenol content in bilberries and blackcurrants, respectively. Only one major phenolic acid, chlorogenic acid, was observed, but only in bilberries (Table 2).
Body weight and food intake
As expected, body weight and food intake increased gradually during the experiment. No differences in body weight gain (p = 0.4424) and final body weight (control: 452 g ± 46 g, bilberry: 479 g ± 25 g, blackcurrant: 445 g ± 48 g, fiber: 470 g ± 26 g; p = 0.1183) were observed between diet groups. Likewise, no interaction in food intake between time and treatment emerged with the exception of 11 weeks of age, when the mean intake in the bilberry group (31.3 g ± 3.6 g) was lower than in the control group (36.8 g ± 4.4 g; p < 0.01) and the fiber group (36.0 g ± 4.1 g; p < 0.05).
Glucose metabolism
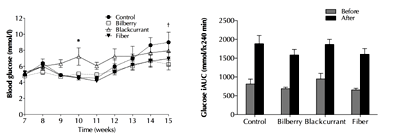
At baseline, glycemic control and fasting insulin did not differ significantly among the diet groups (p ≥ 0.1396, data not shown). As illustrated in Figure 1, fasting whole blood glucose was significantly higher in the blackcurrant group (7.2 mmol/l) compared with the control group (4.6 mmol/l, p < 0.05) and the fiber group (4.6 mmol/l, p < 0.05) at 10 weeks of age, and significantly lower in the bilberry group (6.2 mmol/l) compared with the control group (9.0 mmol/l, p < 0.05) at the end of trial.
In contrast, fasting plasma glucose did not differ among the groups at the end of trial (Table 3, p = 0.2346), nor did HbA1c (p = 0.25). Likewise, the iAUC0-240min, for glucose (Figure 1) and the increments in fasting insulin (Table 3) were similar among the diet groups at the end of the experiment (p = 0.815 and p = 0.24, respectively). Furthermore, HOMA-IR and HOMA-β appeared not to be significantly affected by the dietary interventions (p = 0.174, p = 0.135, respectively; Table 3).
Table
3.
Plasma insulin, glycemic control parameters, blood pressure, and heart rate after 8-week treatment with a control, bilberry-, blackcurrant- or fiber-enriched diet |
|
 |
|
Legend:
Data are means ± SEM, n = 11-12/group. No effect of dietary intervention, one-way ANOVA, adjusted for baseline. Abbreviations: HbA1c - glycosylated hemoglobin; HOMA-IR- homeostasis model assessment of insulin resistance; HOMA-β - homeostasis model assessment of β-cell function (insulin sensitivity). |
|
 |
|
Figure 1. Effects of 8-week diet treatment of Zucker Diabetic Fatty (ZDF) rats. The diets consisted of a control as well as bilberry, blackcurrant, and fiber enrichment. The diagrams show the weekly changes in fasting whole blood glucose (left) and incremental area under the curve (iAUC) for plasma glucose (right) measured by oral glucose tolerance test before and after intervention. Data are shown as mean ± SEM, n = 11-12/group. * p < 0.05 blackcurrant vs. control and fiber. † p < 0.05 bilberry vs. control by two-way repeated measures ANOVA. |
|
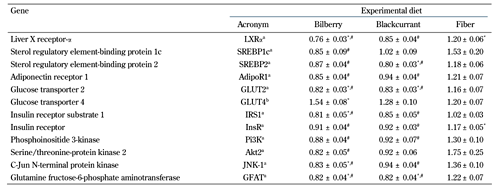
When compared with the control group, the hepatic mRNA expression of GLUT-2, IRS-1, JNK-1, and GFAT were downregulated in the bilberry group (20%, p < 0.05; 19% p < 0.01; 17% p < 0.05; 20% p < 0.05, respectively), and GLUT2 and GFAT were downregulated in the blackcurrant group (18% and 19%, respectively; p < 0.05 for all) (Table 4). Likewise, when compared with the fiber group, the hepatic expression of Adipor1, GLUT2, IRS1, InsR, Pi3K, JNK-1, and GFAT were downregulated in the bilberry group (30%, p < 0.001; 29%, p < 0.001; 20%, p < 0.01; 22%, p < 0.001; 32%, p < 0.001; 39%, p < 0.001; 33%, p < 0.001, respectively) and in the blackcurrant group (22%, p < 0.01; 28%, p < 0.001; 16%, p < 0.05; 21%, p < 0.001; 29%, p < 0.01; 31%, p < 0.01; 33%, p < 0.001, respectively) (Table 4).
Table
4.
Relative expression of selected genes involved in lipid and glucose metabolism in Zucker Diabetic Fatty rats after 8-week dietary intervention |
|
 |
|
Legend:
Data are means ± SEM, expressed relative to the control diet, n = 11-12/group. Quantitative RT-PCR was performed for the selected genes, and was normalized to the geometric mean of two endogenous controls (S18 and Hprt1). a Expressed in hepatic tissue. b Expressed in subcutaneous adipose tissue. * p < 0.05 vs. control diet, one-way ANOVA or Kruskal-Wallis' test. # p < .05 vs. fiber diet, one-way ANOVA or Kruskal-Wallis' test. |
|
In addition, the hepatic expression of Akt2 (53%, p < 0.01) was downregulated in the bilberry versus fiber group. The fiber diet upregulated the expression of hepatic InsR compared with the control diet (16%, p < 0.05; Table 4). In adipose tissue, the expression of GLUT4 was upregulated in the bilberry group compared with the control group (40%, p < 0.01; Table 4). In muscle tissue, gene expression levels were similar between the selected genes. Diets did not affect adiponectin differently in any of the tissues (data not shown).
Lipid profile
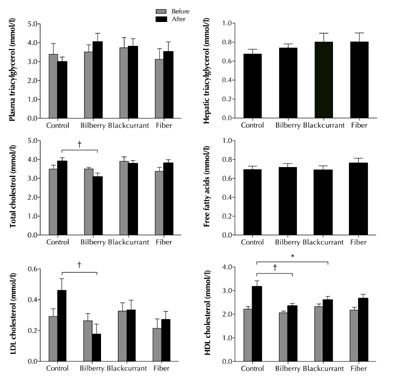
As shown in Figure 2, no lipid variables differed between diet groups at baseline (p ≥ 0.349). During the experiments, the mean total cholesterol increased in the control and fiber group, whereas the levels decreased in the two berry groups. At the end of the experiments, total cholesterol was significantly lower in the bilberry group compared with the control group (-21%, p = 0.003, Figure 2).
 |
|
Figure 2. Effects of 8-week treatment with a control, bilberry-, blackcurrant-, and fiber-enriched diet on plasma and hepatic triacylglycerol, plasma total cholesterol, free fatty acids, LDL-cholesterol, and HDL-cholesterol levels in Zucker Diabetic Fatty rats. Values are mean ± SEM, n = 11-12/group. One-way ANOVA, adjusted for baseline. * p < 0.05. † p < 0.01 versus control diet. |
|
Over time, LDL-cholesterol decreased in the bilberry group and increased in the remaining groups. Consequently, the bilberry group exhibited a significantly lower LDL-cholesterol concentration at the end of trial compared with the control group (-60%, p = 0.004, Figure 1). As can be seen in Figure 2, HDL-cholesterol increased in all groups. However, at the end of the trial, HDL-cholesterol had increased significantly more in the control group than in the bilberry (26%, p = 0.003) and blackcurrant group (18%, P = 0.037). In addition, HDL-cholesterol tended to increase more in the control versus fiber group (16%, p = 0.069). No significant differences in plasma FFA (p = 0.6479) or in triacylglycerol in either plasma (p = 0.272) or liver (p = 0.71) were observed between the dietary groups (Figure 2).
When compared with the control group, hepatic mRNA expression of LXR-α was downregulated in the bilberry group (24%, p < 0.001), and SREBP-2 was downregulated in the blackcurrant group (22%, p < 0.05) (Table 4). Likewise, when compared with the fiber group, the hepatic expression of LXR-α and SREBP2 was decreased in the bilberry (36%, p < 0.001; 26%, p < 0.001, respectively) and the blackcurrant groups (29%, p < 0.001; 33%, p < 0.001, respectively) (Table 4). In addition, the hepatic expression of SREBP1c (45%, p < 0.01) was downregulated in the bilberry versus fiber group. The group fed a fiber diet exhibited an upregulation of hepatic LXR-α compared with the group fed control diet (19%, p < 0.05, Table 4). The diets did not differentially affect LPL or FABP4 in any of the tissues (data not shown).
Blood pressure and heart rate
As shown in Table 3, the animals exhibited an elevated systolic blood pressure at the end of the trial, i.e., at 15 weeks of age. However, neither systolic blood pressure (p = 0.842) nor heart rate were differentially affected between the diet groups (p = 0.761).
Discussion
To our knowledge, this is the first trial to report the effects of bilberries and blackcurrants per se on selected CVD risk factors in ZDF rats. The present trial demonstrated that a diet enriched with bilberries improved lipid profile by reducing total cholesterol by 21% and LDL-cholesterol by 60%. However, bilberry as well as blackcurrant enrichment resulted in less elevation of HDL-cholesterol than the control diet. No impact of diet enrichment with bilberries or blackcurrants was detected on glucose tolerance, insulin sensitivity or blood pressure.
The lipid-ameliorating effect of bilberries is an appealing finding, as hyperlipidemia, especially elevated LDL-cholesterol, is strongly related to the development of atherosclerosis [25]. An identical effect on total cholesterol has recently been observed in duplicate with an anthocyanin-rich bilberry extract given to atherosclerotic (apo E-/-) mice for two weeks [26, 27]. Moreover, a reduction in total cholesterol was observed in diabetic (KK-Ay) mice when treated with anthocyanin-rich bilberry extract (27 g/kg diet) for 5 weeks [16] and in Fisher rats treated with an anthocyanin-rich grape-bilberry juice for 10 weeks [28].
In other trials, the consumption of bilberries as either juice, anthocyanin-rich extract or in conjunction with other kind of berries induced no effect on total cholesterol [10, 12-15]. In accordance with the present findings, Qin et al. reported a suppressed LDL-cholesterol response to an extract of mixed anthocyanins from bilberry and blackcurrant (320 mg/day) given to dyslipidemic subjects for 12 weeks [14].
Food intake and body weight did not differ between the diet groups, suggesting that neither of these parameters contributed to the suppression of total and LDL-cholesterol. Moreover, it seems unlikely that the positive effect of bilberry was ascribed to its higher content of dietary fiber compared with the control, as both the blackcurrant and the fiber group had fiber content comparable with bilberry but exhibited no effect on cholesterol concentrations. However, the relatively high content of anthocyanins combined with a more complex anthocyanin composition in bilberries compared with blackcurrants could indicate that anthocyanins may play an important role in the observed cholesterol-lowering effect of bilberry.
The liver is the key organ in maintaining cholesterol homeostasis, and bilberry-extract has recently been suggested to modulate the hepatic expression of genes involved in cholesterol metabolism [26]. In the present study, the expression of LXR-α was downregulated by the bilberry diet compared with the control diet (fold change = 0.76), consistent with the lower cholesterol levels. LXR-α promotes the hepatic production of apolipoprotein B-containing lipoprotein particles [29], and synthetic LXR agonists have been shown to increase LDL-cholesterol and apolipoprotein B in non-human primates [30]. In addition, LXR-α activation promotes cholesterol biosynthesis and lipogenesis through the regulation of lipogenic master genes like SREBP-1c and SREBP2 [31]. However, SREBP-1c and SREBP2 mRNA were not downregulated to a statistically significant level by bilberry treatment (fold change = 0.85 and 0.87, respectively).
Unexpectedly and contrary to human trials [13, 14], HDL-cholesterol increased to a lesser extent in the bilberry group compared with the control group. To our knowledge, no animal trials have reported the effect of bilberries or blackcurrants on HDL separately, though two studies in rats have reported no effect on the HDL to LDL ratio although the total cholesterol level was reduced [26, 27]. This conflicting finding may somehow be explained by the physiological differences that exist in human and rodent HDL metabolism. In line with this, treatment with fibrates lowers HDL levels in rodents by reducing PPARα activation, which decreases the expression of the HDL major apolipoprotein, Apo A-I in liver, whereas in humans, fibrates increase plasma HDL levels via enhanced Apo A-I gene expression induced by increased PPARα activation [32, 33]. Mechanistically, the smaller increase in HDL-cholesterol observed following the berry diets may be explained by the downregulation of hepatic LXR-α mRNA, given that this nuclear factor activates the transcription of a spectrum of genes regulating reverse cholesterol transport and thereby raises HDL-cholesterol [34].
As for triacylglycerol, similar levels were observed in both the plasma and liver, which corroborates the findings obtained in most [11-15, 27, 28] but not all trials [16, 26]. Differing effects of whole berry powder versus purified berry anthocyanins intake may in part explain the conflicting findings on triacylglycerol [35]. The lack of differences in the plasma and hepatic triacylglycerol between groups corroborates the gene expression findings and the comparable findings of plasma insulin and FFA among the diets.
In general, glucose metabolism was not modified by bilberry or blackcurrant enrichment of the diet, as shown previously [11, 12, 14, 28], but not unequivocally [16]. Dietary fructose appears to attenuate hepatic insulin signaling by JNK activation [36]. Accordingly, one possible explanation for the diverging findings could be ascribed to the use of berry anthocyanin-rich extracts versus whole berry powder because of the amount of fructose present in berries [37]. Furthermore, comparing the berry diets with a control and fiber diet containing no monosaccharides, as was done in the present study, might blur a potential ameliorating effect of bilberries and blackcurrants on glucose metabolism.
Fiber-enrichment per se had no beneficial effect on glucose metabolism either, which corresponds with other rodent trials investigating the effect of cellulose, the primary fiber component used in the present trial [38, 39]. Skeletal muscle is the primary site of glucose disposal and therefore is a major tissue that contributes to plasma glucose levels. Nevertheless, no differences in the expression of genes related to glucose metabolism in muscle tissue were observed, mimicking the findings in biochemical glucose parameters.
Changes in the expression levels of genes related to glucose metabolism were almost exclusively observed in hepatic tissue, which can partly be explained by the tissue distribution of anthocyanins. In mice, anthocyanins were detected in the liver but not in muscle or white fat tissue after the consumption of bilberry extract [40]. It has previously been shown that increased GFAT activity is associated with insulin resistance and postprandial hyperglycemia in T2D [41]. In addition, hepatic JNK-1 induces insulin resistance by serine phosphorylation of IRS1 [42]. Due to reduced GFAT and JNK-1 expression induced by bilberry intake (fold change = 0.82 and 0.83, respectively), hepatic insulin sensitivity may therefore be slightly more conserved when adding bilberries to the diet, which may also explain the lower fasting whole blood glucose level observed at the end of the trial and the putative decrease in hepatic oxidative stress [43]. This is further supported by the hepatic GLUT2 down-regulation [44]. In contrast, expression levels of IRS1 were lowered by bilberry intake, suggesting impaired insulin signaling. However, the lower transcription of IRS1 could indicate a lower degree of JNK-mediated IRS1 phosphorylation as a direct result of the lower JNK-1 transcription rather than impaired insulin signaling. Moreover, transcriptional changes in adipose tissue imply enhanced adipocyte insulin sensitivity in the bilberry group, as the expression of GLUT4 was upregulated [44].
At 15 weeks of age, the animals exhibited mild hypertension. A modest blood pressure-lowering effect of bilberry consumed together with other berries has been indicated [13]. However, we did not observe differences in the systolic blood pressure between diets, corroborating previous observations [11, 12, 14].
Conclusions
In conclusion, the present study demonstrated that bilberry intake ameliorated total cholesterol and LDL-cholesterol levels in ZDF rats, possibly by inhibiting hepatic LXR-α gene expression. A blunted increase in the HDL-cholesterol level was observed in the bilberry- and blackcurrant-enriched diets compared with the control. In contrast to our hypothesis, neither bilberry nor blackcurrant enrichment delayed the development of T2D or influenced blood pressure differently from the control diet. Nevertheless, changes in gene expression implied less impaired hepatic and adipocyte insulin sensitivity after bilberry supplementation.
The results indicate that bilberries, possibly by virtue of their relatively high content of anthocyanins, may serve as a valuable dietary preventative agent in hypercholesterolemia. However, caution should be exercised in the interpretation of our results because there are significant differences in HDL cholesterol metabolism between rats and humans. Consequently, further research is needed to determine whether the observed effects in rats also apply to humans.
Disclosures/Conflict of Interests: None of the authors have any financial or personal conflicts of interest to declare.
Acknowledgments:
We wish to thank Susanne Rasmussen Molboe at the Danish Veterinary and Food Administration for performing the macronutrient and dietary fiber analyses of the berry powders. This work was funded by the Knowledge and Research Centre for Alternative Medicine (ViFAB), The Ministry of Health and Prevention, Denmark, and by Sysdiet (Systems biology in controlled dietary interventions and cohort studies), a Nordic Centre of Excellence Program on Food, Nutrition, and Health; NordForsk (SYSDIET; 070014).
References
- Roger VL, Go AS, Lloyd-Jones DM, Benjamin EJ, Berry JD, Borden WB, Bravata DM, Dai S, Ford ES, Fox CS, et al. Executive summary: heart disease and stroke statistics - 2012 update: a report from the American Heart Association. Circulation 2012. 125:188-197. [DOD] [CrossRef]
- Dauchet L, Amouyel P, Hercberg S, Dallongeville J. Fruit and vegetable consumption and risk of coronary heart disease: a meta-analysis of cohort studies. J Nutr 2006. 136:2588-2593. [DOD]
- Chong MF, Macdonald R, Lovegrove JA. Fruit polyphenols and CVD risk: a review of human intervention studies. Br J Nutr 2010. 104(Suppl 3):S28-S39. [DOD] [CrossRef]
- Kaczmarczyk MM, Miller MJ, Freund GG. The health benefits of dietary fiber: beyond the usual suspects of type 2 diabetes mellitus, cardiovascular disease and colon cancer. Metabolism 2012. 61:1058-1066. [DOD] [CrossRef]
- Zafra-Stone S, Yasmin T, Bagchi M, Chatterjee A, Vinson JA, Bagchi D. Berry anthocyanins as novel antioxidants in human health and disease prevention. Mol Nutr Food Res 2007. 51:675-683. [DOD] [CrossRef]
- Koli R, Erlund I, Jula A, Marniemi J, Mattila P, Alfthan G. Bioavailability of various polyphenols from a diet containing moderate amounts of berries. J Agric Food Chem 2010. 58:3927-3932. [DOD] [CrossRef]
- Maatta-Riihinen KR, Kamal-Eldin A, Mattila PH, Gonzalez-Paramas AM, Torronen AR. Distribution and contents of phenolic compounds in eighteen Scandinavian berry species. J Agric Food Chem 2004. 52:4477-4486. [DOD] [CrossRef]
- Ehala S, Vaher M, Kaljurand M. Characterization of phenolic profiles of Northern European berries by capillary electrophoresis and determination of their antioxidant activity. J Agric Food Chem 2005. 53:6484-6490. [DOD] [CrossRef]
- Huebbe P, Giller K, de Pascual-Teresa S, Arkenau A, Adolphi B, Portius S, Arkenau CN, Rimbach G. Effects of blackcurrant-based juice on atherosclerosis-related biomarkers in cultured macrophages and in human subjects after consumption of a high-energy meal. Br J Nutr 2012. 108:234-244. [DOD] [CrossRef]
- Karlsen A, Paur I, Bohn SK, Sakhi AK, Borge GI, Serafini M, Erlund I, Laake P, Tonstad S, Blomhoff R. Bilberry juice modulates plasma concentration of NF-kappaB related inflammatory markers in subjects at increased risk of CVD. Eur J Nutr 2010. 49:345-355. [DOD] [CrossRef]
- Kolehmainen M, Mykkanen O, Kirjavainen PV, Leppanen T, Moilanen E, Adriaens M, Laaksonen DE, Hallikainen M, Puupponen-Pimia R, Pulkkinen L, et al. Bilberries reduce low-grade inflammation in individuals with features of metabolic syndrome. Mol Nutr Food Res 2012. 56:1501-1510. [DOD] [CrossRef]
- Lehtonen HM, Suomela JP, Tahvonen R, Yang B, Venojarvi M, Viikari J, Kallio H. Different berries and berry fractions have various but slightly positive effects on the associated variables of metabolic diseases on overweight and obese women. Eur J Clin Nutr 2011. 65:394-401. [DOD] [CrossRef]
- Erlund I, Koli R, Alfthan G, Marniemi J, Puukka P, Mustonen P, Mattila P, Jula A. Favorable effects of berry consumption on platelet function, blood pressure, and HDL cholesterol. Am J Clin Nutr 2008. 87:323-331. [DOD]
- Qin Y, Xia M, Ma J, Hao Y, Liu J, Mou H, Cao L, Ling W. Anthocyanin supplementation improves serum LDL- and HDL-cholesterol concentrations associated with the inhibition of cholesteryl ester transfer protein in dyslipidemic subjects. Am J Clin Nutr 2009. 90:485-492. [DOD] [CrossRef]
- Mauray A, Milenkovic D, Besson C, Caccia N, Morand C, Michel F, Mazur A, Scalbert A, Felgines C. Atheroprotective effects of bilberry extracts in apo E-deficient mice. J Agric Food Chem 2009. 57:11106-11111. [DOD] [CrossRef]
- Takikawa M, Inoue S, Horio F, Tsuda T. Dietary anthocyanin-rich bilberry extract ameliorates hyperglycemia and insulin sensitivity via activation of AMP-activated protein kinase in diabetic mice. J Nutr 2010. 140:527-533. [DOD] [CrossRef]
- Shiota M, Printz RL. Diabetes in zucker diabetic fatty rat. Methods Mol Biol 2012. 933:103-123. [DOD]
- Etgen GJ, Oldham BA. Profiling of Zucker diabetic fatty rats in their progression to the overt diabetic state. Metabolism 2000. 49:684-688. [DOD] [CrossRef]
- Gavrilova V, Kajdzanoska M, Gjamovski V, Stefova M. Separation, characterization and quantification of phenolic compounds in blueberries and red and black currants by HPLC-DAD-ESI-MSn. J Agric Food Chem 2011. 59:4009-4018. [DOD] [CrossRef]
- Sun J, Lin LZ, Chen P. Study of the mass spectrometric behaviors of anthocyanins in negative ionization mode and its applications for characterization of anthocyanins and non-anthocyanin polyphenols. Rapid Commun Mass Spectrom 2012. 26:1123-1133. [DOD] [CrossRef]
- Livak KJ, Schmittgen TD. Analysis of relative gene expression data using real-time quantitative PCR and the 2(-Delta Delta C(T)) Method. Methods 2001. 25:402-408. [DOD] [CrossRef]
- Matthews JN, Altman DG, Campbell MJ, Royston P. Analysis of serial measurements in medical research. BMJ 1990. 300:230-235. [DOD] [CrossRef]
- Matthews DR, Hosker JP, Rudenski AS, Naylor BA, Treacher DF, Turner RC. Homeostasis model assessment: insulin resistance and beta-cell function from fasting plasma glucose and insulin concentrations in man. Diabetologia 1985. 28:412-419. [DOD] [CrossRef]
- Benjamini Y, Hochberg Y. Controlling the false discovery rate: a practical and powerful approach to multiple testing. J R Statist Soc B 1995. 57:289-300. [DOD]
- Ference BA, Mahajan N. The role of early LDL lowering to prevent the onset of atherosclerotic disease. Curr Atheroscler Rep 2013. 15:312. [DOD] [CrossRef]
- Mauray A, Felgines C, Morand C, Mazur A, Scalbert A, Milenkovic D. Nutrigenomic analysis of the protective effects of bilberry anthocyanin-rich extract in apo E-deficient mice. Genes Nutr 2010. 5:343-353. [DOD] [CrossRef]
- Mauray A, Felgines C, Morand C, Mazur A, Scalbert A, Milenkovic D. Bilberry anthocyanin-rich extract alters expression of genes related to atherosclerosis development in aorta of apo E-deficient mice. Nutr Metab Cardiovasc Dis 2012. 22:72-80. [DOD] [CrossRef]
- Graf D, Seifert S, Jaudszus A, Bub A, Watzl B. Anthocyanin-rich juice lowers serum cholesterol, leptin, and resistin and improves plasma fatty acid composition in Fischer rats. Plos One 2013. 8:e66690. [DOD] [CrossRef]
- Basciano H, Miller A, Baker C, Naples M, Adeli K. LXR-alpha activation perturbs hepatic insulin signaling and stimulates production of apolipoprotein B-containing lipoproteins. Am J Physiol Gastrointest Liver Physiol 2009. 297:G323-G332. [DOD] [CrossRef]
- Groot PH, Pearce NJ, Yates JW, Stocker C, Sauermelch C, Doe CP, Willette RN, Olzinski A, Peters T, d'Epagnier D, et al. Synthetic LXR agonists increase LDL in CETP species. J Lipid Res 2005. 46:2182-2191. [DOD] [CrossRef]
- Beltowski J. Liver X receptors (LXR) as therapeutic targets in dyslipidemia. Cardiovasc Ther 2008. 26:297-316. [DOD] [CrossRef]
- Berthou L, Duverger N, Emmanuel F, Langouet S, Auwerx J, Guillouzo A, Fruchart JC, Rubin E, Denefle P, Staels B, et al. Opposite regulation of human versus mouse apolipoprotein A-I by fibrates in human apolipoprotein A-I transgenic mice. J Clin Invest 1996. 97:2408-2416. [DOD] [CrossRef]
- Staels B, Auwerx J. Regulation of apo A-I gene expression by fibrates. Atherosclerosis 1998. 13(Suppl):S19-S23. [DOD] [CrossRef]
- Miao B, Zondlo S, Gibbs S, Cromley D, Hosagrahara VP, Kirchgessner TG, Billheimer J, Mukherjee R. Raising HDL cholesterol without inducing hepatic steatosis and hypertriglyceridemia by a selective LXR modulator. J Lipid Res 2004. 45:1410-1417. [DOD] [CrossRef]
- Prior RL, Wu X, Gu L, Hager T, Hager A, Wilkes S, Howard L. Purified berry anthocyanins but not whole berries normalize lipid parameters in mice fed an obesogenic high fat diet. Mol Nutr Food Res 2009. 53:1406-1418. [DOD] [CrossRef]
- Wei Y, Wang D, Pagliassotti MJ. Fructose selectively modulates c-jun N-terminal kinase activity and insulin signaling in rat primary hepatocytes. J Nutr 2005. 135:1642-1646. [DOD]
- Mikulic-Petkovsek M, Schmitzer V, Slatnar A, Stampar F, Veberic R. Composition of sugars, organic acids, and total phenolics in 25 wild or cultivated berry species. J Food Sci 2012. 77:C1064-C1070. [DOD] [CrossRef]
- Wang ZQ, Zuberi AR, Zhang XH, Macgowan J, Qin J, Ye X, Son L, Wu Q, Lian K, Cefalu WT. Effects of dietary fibers on weight gain, carbohydrate metabolism, and gastric ghrelin gene expression in mice fed a high-fat diet. Metabolism 2007. 56:1635-1642. [DOD] [CrossRef]
- Wang ZQ, Yu Y, Zhang XH, Floyd ZE, Boudreau A, Lian K, Cefalu WT. Comparing the effects of nano-sized sugarcane fiber with cellulose and psyllium on hepatic cellular signaling in mice. Int J Nanomedicine 2012. 7:2999-3012. [DOD] [CrossRef]
- Sakakibara H, Ogawa T, Koyanagi A, Kobayashi S, Goda T, Kumazawa S, Kobayashi H, Shimoi K. Distribution and excretion of bilberry anthocyanins in mice. J Agric Food Chem 2009. 57:7681-7686. [DOD] [CrossRef]
- Srinivasan V, Sandhya N, Sampathkumar R, Farooq S, Mohan V, Balasubramanyam M. Glutamine fructose-6-phosphate amidotransferase (GFAT) gene expression and activity in patients with type 2 diabetes: inter-relationships with hyperglycaemia and oxidative stress. Clin Biochem 2007. 40:952-957. [DOD] [CrossRef]
- Seki E, Brenner DA, Karin M. A liver full of JNK: signaling in regulation of cell function and disease pathogenesis, and clinical approaches. Gastroenterology 2012. 143:307-320. [DOD] [CrossRef]
- Eriksson JW. Metabolic stress in insulin's target cells leads to ROS accumulation - a hypothetical common pathway causing insulin resistance. FEBS Lett 2007. 581:3734-3742. [DOD] [CrossRef]
- Slieker LJ, Sundell KL, Heath WF, Osborne HE, Bue J, Manetta J, Sportsman JR. Glucose transporter levels in tissues of spontaneously diabetic Zucker fa/fa rat (ZDF/drt) and viable yellow mouse (Avy/a). Diabetes 1992. 41:187-193. [DOD] [CrossRef]
This article has been cited by other articles:

|
Current evidence on the health-beneficial effects of berry fruits in the prevention and treatment of metabolic syndrome
Kowalska K, Olejnik A
Curr Opin Clin Nutr Metab Care 2016. 19(6):446-452
|
|

|
Black carrots fermented with Lactobacillus plantarum or Aspergillus oryzae prevent cognitive dysfunction by improving hippocampal insulin signalling in amyloid-β infused rats
Park S, Kang S, Jeong DY, Jeong SY, Kim MJ
J Funct Food 2016. 25:354-366
|
|

|
Action mechanism and cardiovascular effect of anthocyanins: a systematic review of animal and human studies
Reis JF, Monteiro VV, de Souza Gomes R, do Carmo MM, da Costa GV, Ribera PC, Monteiro MC
J Transl Med 2016. 14(1):315
|
|

|
Purified anthocyanin supplementation reduces dyslipidemia, enhances antioxidant capacity, and prevents insulin resistance in diabetic patients
Li D, Zhang Y, Liu Y, Sun R, Xia M
J Nutr 2015. 145(4):742-748
|
|

|
The Regulation Mechanisms of Anthocyanins on Lipid Metabolism in Non-Alcoholic Fatty Liver
Zhou F, Zhang L, Yang Y
J Food Nutr Sci 2015. 4(4):116-122
|
|

|
Alternative Medicine in Diabetes - Role of Angiogenesis, Oxidative Stress, and Chronic Inflammation
El-Refaei MF, Abduljawad SH, Alghamdi AH
Rev Diabet Stud 2014. 11(3-4):231-244
|
|
|


)
)
)
)
)
)