Original Data
| Rev Diabet Stud,
2017,
14(2-3):279-294 |
DOI 10.1900/RDS.2017.14.279 |
Association Between Socioeconomic Determinants and the Metabolic Syndrome in the German Health Interview and Examination Survey for Adults (DEGS1) – A Mediation Analysis
Diego Montano
Department of Psychosomatic Medicine and Psychotherapy, Ulm University, Albert-Einstein-Allee 23, 89081 Ulm, Germany
Manuscript submitted March 28, 2017; resubmitted June 23, 2017; accepted August 1, 2017.
Keywords: metabolic syndrome, social epidemiology, diabetes, hypertension, obesity, multivariate regression
Abstract
BACKGROUND: Metabolic syndrome and different socioeconomic characteristics including education and occupational status have been found to be associated in previous research. Nonetheless, theoretical models defining core variables and causal processes accounting for these associations are lacking. OBJECTIVES: The main objectives of the present investigation are (1) to present a theoretical model integrating physiological, biochemical, and psychosocial factors determining metabolic syndrome prevalence and (2) to corroborate the hypothesis that socioeconomic determinants are (partially) mediated by health-related behaviors, health risks, and dietary habits. METHODS: The research hypothesis is tested with cross-sectional data from the German Health Interview and Examination Survey for Adults (DEGS1) conducted from 2008 to 2011 (n = 7,987) by means of multivariate regression models which appropriately take into account the stochastic dependence of metabolic syndrome components. RESULTS: The results suggest that the metabolic syndrome is less frequent among individuals with a higher educational level and those who have a partner. These associations may point to protective effects of social support, self-efficacy, and other socio-psychological constructs in relation to metabolic syndrome incidence. Furthermore, frequent consumption of wine, muesli, fruits, and raw vegetables are associated with lower prevalence rates of metabolic syndrome components. The associations of occupational status, income, and employment are partially mediated by health-related behavior, physiological and psychosocial factors, and dietary habits. Sensitivity analyses have suggested that even small changes in the distribution of potential risk and protective factors may reduce the prevalence of metabolic syndrome components. CONCLUSIONS: Healthrelated behavior (smoking, physical activity) and physiological and psychosocial factors mediate the association between socioeconomic characteristics and metabolic syndrome prevalence. However, metabolic syndrome components were much less frequent among individuals with a higher educational level, higher income and occupational status, and those having a life partner.
Abbreviations: AHA - American Heart Association; BMI - body mass index; DEGS1 - German Health Interview and Examination Survey for Adults; HDL - high-density lipoprotein cholesterol; IDF - International Diabetes Federation; NHLBI - National Heart, Lung, and Blood Institute; ISEI - International Socio-Economic Index of Occupational Status; MAD - median absolute deviation; MHB - multivariate hierarchical Bayesian; PSU - primary sampling unit
1. Introduction
Although different attempts to define the metabolic syndrome have been proposed for clinical practice and research, the most general working definition consists of the cooccurrence of glucose intolerance (or type 2 diabetes) in combination with obesity, hypertension, and/or dyslipidemia [1]. More recently, a classification procedure has been recommended by the International Diabetes Federation (IDF) and other health organizations (AHA/NHLBI), whereby the metabolic syndrome was diagnosed if any 3 out of the following 5 risk factors are present:
- Elevated waist circumference (cut-off values depend on population- and country-specific definitions)
- Elevated triglycerides (or corresponding drug treatment) (≥150 mg/dl)
- Reduced high-density lipoprotein cholesterol (HDL-C) (or corresponding drug treatment) (<40 mg/dl males, <50 mg/dl females)
- Elevated blood pressure (or corresponding drug treatment) (systolic ≥130 and/or diastolic ≥85 mmHg)
- Elevated fasting glucose (or corresponding drug treatment) (≥100 mg/dl) [2].
Previous epidemiological studies with data from the general population in Europe, the USA, China, and South Korea have reported similarly high prevalence rates of 24.3%, 22.9%, 24.5%, and 16.3%, respectively [3-6], despite the use of different diagnostic criteria for each specific population. Also, estimates of all-cause and cardiovascular mortality rates based on 11 prospective European cohort studies are higher among persons diagnosed with the metabolic syndrome than among persons without it [7]. The presence of hyperinsulinemia plus 2 or more other components, including obesity, hypertension, dyslipidemia, and impaired glucose regulation, has been associated with increased risk of mortality, especially among men [7].
Yet, several scholars have criticized the metabolic syndrome concept for its lack of clinical usefulness [8]. Important limitations concern the loss of information due to dichotomization of the metabolic syndrome and/or its components, omission of established risk factors such as age and sex, heterogeneity of syndrome definitions leading to identification of different sub-populations at risk, and difficulties regarding the appropriate weighting of metabolic syndrome components [9]. In face of these limitations, it has been argued that the metabolic syndrome should not be applied as a clinical diagnosis or management tool [9, 10].
1.1 Socioeconomic determinants
In spite of the fact that the pathogenesis of the metabolic syndrome has not been fully understood so far, one of the most accepted pathophysiological mechanisms is insulin resistance. Previous findings have suggested an association between insulin resistance and reduction in HDL cholesterol, increased risk of hypertriglyceridemia, hypertension, higher rates of proinflammatory cytokines, and impaired glucose tolerance [1, 11, 12]. In general, these conditions lead to increased cardiovascular disease and risk of type 2 diabetes, and are often co-determined by socioeconomic and psychosocial factors. For instance, depending on the country's socioeconomic development, the prevalence of major risk factors such as blood pressure, smoking, fasting plasma glucose, and total cholesterol are associated with education [13]. Health risks and health-adverse outcomes are usually more frequent among groups with lower education and socioeconomic status [14]. Moreover, lifestylerelated factors playing a key role in the clinical management of the metabolic syndrome [15], such as physical activity, diet characteristics, and smoking behavior, are largely determined by social learning processes and social experiences during an individual's lifetime [16, 17].
Previous research focusing on the associations between socioeconomic determinants and the metabolic syndrome has provided evidence of increased metabolic syndrome risk among individuals with lower education or low socioeconomic status [18-22]. However, these results are limited in two major aspects:
- They lack a theoretical model accounting for the specific mechanisms linking socioeconomic determinants and the metabolic syndrome. Consequently, variable selection remains arbitrary to some extent, and does not enable a systematic understanding of causal processes.
- The statistical methods used in previous research do not take into account the stochastic dependence between the different metabolic syndrome components, and therefore fail to synthesize the strength of associations between dependent variables and metabolic syndrome components.
In order to advance the understanding of these phenomena, a theoretical model explaining how different socioeconomic characteristics of individuals are associated with the probability of the metabolic syndrome is proposed in the present investigation. In addition, multivariate regression methods which appropriately take into account the stochastic dependence of metabolic syndrome components will be utilized to investigate the validity of the research hypothesis.
1.2 Theoretical model and research hypothesis
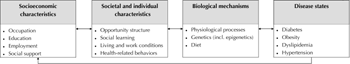
The interplay of physiological, biochemical, and psychosocial factors influencing metabolic syndrome prevalence can be theoretically explained in the bio-psychosocial model depicted in Figure 1. The model states that the socioeconomic characteristics of individuals interact with the opportunity structure of society (e.g. job and income opportunities). At the same time, these characteristics codetermine social learning processes and experiences increasing the probability of particular healthrelated behaviors (e.g. smoking) as well as living and work conditions (e.g. neighborhoods and occupational class). Therefore, these processes imply that socioeconomic characteristics may indirectly affect the biological mechanisms responsible for the occurrence of particular health states. It is thus expected that these characteristics have only a mediated effect on the probability of observing certain health states such as the metabolic syndrome.
 |
 |
Figure 1. Theoretical model of potential causal pathways between socioeconomic determinants and metabolic syndrome onset. |
|
Within this theory, for instance, education and occupational status would have an indirect effect on health by determining the quality of living conditions, exposure levels to noxious chemical or physical agents at work and home, particular dietary habits via social learning processes with family, friends and peer groups, and consequently by triggering biological mechanisms leading to the cooccurrence of metabolic syndrome components. Finally, since health state, physiological processes, and genetic predisposition obviously have an impact on the socioeconomic characteristics of individuals (e.g. loss of income due to impairment of bodily structures and/or functions), the theoretical model considers reverse causation effects or feedback processes.
On the basis of these theoretical considerations, the present investigation aims to evaluate data from the German Health Interview and Examination Survey for Adults (DEGS1) under the following research hypothesis:
H1: The associations between the socioeconomic characteristics of individuals and the metabolic syndrome are (partially) mediated by:
- Health-related behavior associated with social learning processes (smoking and physical activity)
- Physiological and psychosocial risk and/or protective factors linked to specific biological mechanisms (mental health states)
- The specific profile of dietary habits directly determining several states of metabolic dysfunction and cardiovascular disease such as insulin resistance and type 2 diabetes (consumption frequency of fruits, vegetables, dietary fibers, sweets, and alcoholic beverages).
As mentioned above, the metabolic syndrome concept has low utility as a clinical diagnosis or disease management tool. Hence, in the present study, the metabolic syndrome denotes the observed increased probability of the co-occurrence of specific symptoms and/or diseases associated with higher mortality risk. More importantly, the research hypothesis will be tested by considering simultaneously the prevalence of metabolic syndrome components by the multivariate methods described below, and by assessing the extent to which relevant health-adverse factors and socioeconomic characteristics are associated with the co-occurrence of two or more metabolic syndrome components. By adopting a multivariate approach, all permissible combinations of metabolic syndrome and the actual values of the single components are being taken into account. Therefore, potential biases arising from misclassification of the syndrome and/or dichotomization of the metabolic syndrome and its single components are reduced.
2. Methods
2.1 Sample
The German Health Interview and Examination Survey for Adults (DEGS1) conducted by the Robert Koch Institute between 2008 and 2011 is a large random sample of the German adult population 18-79 years of age [23, 24]. The DEGS1 is a two-stage stratified cluster sample, with subdivisions called primary sampling units (PSUs) which are based on the German administrative districts. The sampling probabilities are proportional to the PSU sizes. Within each PSU, local population registers were stratified by 10-year age groups, from which simple random samples of individuals were drawn. Eligible persons in the PSUs were invited to participate in the survey. Data collection in the PSUs was performed by a team composed of a study physician and three technicians. Information contained in the DEGS1 survey and utilized in the present study consists of:
- A semiquantitative, self-administered food frequency questionnaire
- An assessment of currently used medications (prescription and over-the-counter)
- A standardized physician-administered, computer-assisted personal interview
- A standardized questionnaire completed by the survey participants
- Standardized measurements and physical performance tests
The full sample size (including missing data) considered in the present study comprised 7,987 participants. Depending on the type of analyses, as presented below, the effective sample size of the complete-case dataset varied from 5,854 to 6,866 records. According to the Robert Koch Institute [25], the DEGS1 data included in the public use file available to the author did not contain information on ethnicity or migratory background of participants since the sample is not satisfactorily representative of Germany's immigrant population. Therefore, specific factors associated with the migratory background of individuals could not be considered. Because of this, combined with the fact that the response rates in the DEGS1 were only about 42% [23], inferences made in the present investigation were not intended to be representative of the entire German population.
According to the Robert Koch Institute (RKI), "the implementation of DEGS1 conforms to the principles outlined in the Declaration of Helsinki and to the German Federal Data Protection Act." The RKI also stated: "The DEGS1 study protocol was consented with the Federal and State Commissioners for Data Protection and approved by the Charité-Universitätsmedizin Berlin ethics committee in September 2008 (No. EA2/047/08). Participants provided written informed consent prior to the interview and examination" [23].
The data analyzed for this investigation were obtained from the DEGS1 public use file made available by the RKI on request [24].
2.2 Multiple imputation
In order to deal with potential bias resulting from item non-response, the whole dataset was imputed by the method of chained equations [26]. Categorical and metrical variables were imputed by multinomial log-linear models via neural networks and predictive mean matching, respectively. Ten imputed datasets containing the 31 variables considered in the present study were generated by massive imputation using a total of 301 different predictor variables, including 174 health-related, 11 dietary, and 16 sociodemographic variables. The distribution of the 31 imputed variables in each of the ten imputed datasets was compared with the original distribution of the complete-case dataset (i.e. the dataset obtained by listwise deletion of cases with missing data). These distributions along with a more detailed description of the imputation methods are fully reported in the supplemental material.
2.3 Variables
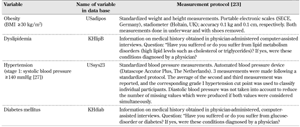
Definition of the metabolic syndrome in the DEGS1. The definition of the metabolic syndrome on the basis of all cut points and criteria recommended in the IDF and AHA/NHLBI joint statement (see introduction section) cannot be applied with the information supplied in the DEGS1 dataset available to the author. Therefore, variables which could serve as proxy measures of the IDF-AHA/NHLBI diagnostic criteria were selected from the DEGS1 public use file. An overview of the proxy measures used to define the metabolic syndrome and their measurement protocol are provided in Table 1. All dependent variables are dichotomous variables (0 = absence of disease or disorder, 1 = presence of disease or disorder).
Table
1.
Definition of the metabolic syndrome using data from the DEGS1 public use file |
|
 |
|
Sociodemographic variables. The educational levels are reported in the CASMIN Educational Classification scheme [28]. They are distinguished:
- Primary education (not completed general education, general elementary education, and basic vocational training)
- Intermediate education (from intermediate general education to vocational maturity education)
- Tertiary education (lower and higher tertiary education)
Occupational status is operationalized on the basis of the International Socio-Economic Index of Occupational Status (ISEI) [29]. The ISEI measures the attributes of occupations that convert the respondent’s educational level into income levels and thus operationalizes social prestige on the basis of power resources available to individuals [30]. Income status is assessed by the equalized net household income which takes into account both household size and composition [29]. Occupational and income status were assessed by ordinal variables ranging from 1.0 to 7.0 using intervals of 0.5. Information on life partner is reported as a categorical variable with the following three levels:
- Respondent is not married and does not have a life partner
- Respondent is married and lives with spouse
- Respondent has a life partner (i.e. not married, separated, divorced or widowed but with life partner)
Employment status is reported by assessing whether the respondent:
- Has never been employed
- Was formerly employed (retired or unemployed)
- Is currently employed
Health-related behaviors. Smoking status was assessed by the question "Do you currently smoke, even if occasionally?" The response format was: 1 = yes, daily, 2 = yes, occasionally, 3 = no, formerly smoker, 4 = no, never smoked. Physical activity was measured by the question “How frequently do you do sports?” The response format was: 1 = no sport, 2 = less than 1 hour per week, 3 = often, between 1 and 2 hours per week, 4 = often, between 2 and 4 hours per week, 5 = often, more than 4 hours per week.
Potentially health-adverse factors and/or risks. The DEGS1 public use file contains several mental health-related variables, including data from screening instruments of affective or stress symptoms and information on diagnosed mental disorders. Even though mental disorders or psychosocial hazards are likely to be associated with metabolic syndrome prevalence, in the present study, only depression and anxiety, two of the most frequently diagnosed mental disorders, were included in the analysis. It is thus intended to focus on mental health states which may have a stronger association with the prevalence of metabolic syndrome components.
Medication. Given the cross-sectional design of the DEGS1 datasets, it is necessary to take into account in the regression models whether the respondent is currently under treatment for metabolic syndrome components since some interventions may have direct consequences on the status of these components. Therefore, the fully adjusted models described below include four additional variables on whether the respondent is currently taking anti-hypertensives, beta blockers, dyslipidemic medication, or antidiabetic agents (response format: 0 = no, 1 = yes). No further medications or interventions such as weight loss or lifestyle were included in the analysis.
Dietary habits. Dietary habits related to the major food types discussed in the introduction section were assessed by the general question: "How often do you eat/drink ...?" The response format was: 1 = never, 2 = once per month, 3 = 2-3 times per month, 4 = 1-2 times per week, 5 = 3-4 times per week, 6 = 5-6 times per week, 7 = once per day, 8 = 2 times per day, 9 = 3 times per day, 10 = 4-5 times per day, 11 = more than 5 times per day). The variables included in the present study cover the following four major food types:
- Beverages (sweet drinks, beer, wine, liquors)
- Dietary fiber (muesli, whole-grain bread)
- Animal products (hard cheese, sausages, meat, fish)
- Fruits and vegetables (raw and cooked)
2.4 Regression models
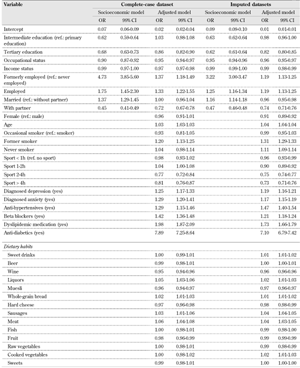
The research hypothesis is investigated by means of multivariate hierarchical Bayesian (MHB) models, as described in detail elsewhere [31]. In general, these models are defined by considering the left-hand side of the regression equation as a matrix of dependent variables and estimating individual-specific random effects. Since the metabolic syndrome is defined in terms of the increased co-occurrence of different disorders and/or dysfunctional states, it is necessary to account for the statistical dependence among those health states defining the syndrome. The research hypothesis was thus examined by estimating two MHB regression models. The first model was called the socioeconomic model and included socioeconomic variables only at the right-hand side of the regression model. In the second model (the fully adjusted model) in contrast, health-related behaviors, potential health risks, and dietary habits were included as mediators. In both models, the matrix of dependent variables comprises the four variables defining the metabolic syndrome, namely diabetes mellitus, obesity, dyslipidemia, and stage 1 hypertension. The results obtained from the MHB regression models represent odds ratios averaged over all four dependent variables. For instance, an odds ratio of 1 for a certain independent variable means that the average association across all four metabolic syndrome components is 1. The socioeconomic and the fully adjusted model were estimated:
- Using the complete-case dataset (n = 6,589 and n = 5,854, respectively)
- Using each one of the ten imputed datasets (n = 7,987)
The results obtained using the ten imputed datasets were summarized by taking the mean of the odds ratios and corresponding standard errors from the estimated models. A detailed description of the MHB regression models and their mixing properties are provided in the supplemental material.
The regression models described above and the number and type of variables were determined before performing the estimation of the MHB models to reduce the risk of false positive results arising from the large sample size and number of potential combinations of data [32]. The reported confidence intervals were estimated at the 99% level to reduce the probability of false positives for small effects [33]. P-values are not supplied since they give poor information about the likely result of a future replication [34].
2.5 Predictive power and sensitivity analyses
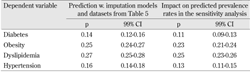
Predictive power analyses were performed to examine the adequacy of model specification and robustness of results. Predictive power analysis was based on 1000 observations randomly sampled from the complete-case dataset, and plugged into the fully adjusted regression models as new observations. Subsequently, 1000 estimates from the posterior distribution of the estimated model were sampled to obtain the matrix of predicted prevalence rates for single metabolic syndrome components. Sensitivity analyses were performed by randomly sampling again 1000 observations from the original dataset, but with the following conditions:
- The sampling probability of an observation was reduced by one-third if smoking behavior = "current smoker", physical activity = "never", diagnosed depression = "yes", anxiety = "yes", being treated for metabolic syndrome components, and if income status = 1 to 3.
- The sampling probability of an observation was increased by two for more frequent muesli and fruit consumption, and by three for more frequent physical activity, having a partner, and not being treated for metabolic syndrome components.
This modified dataset was used again to predict new prevalence rates from the posterior distribution of the estimated regression model, as explained before.
It should be noted that the parameter values used in the sensitivity analysis are chosen arbitrarily (e.g. doubling the sampling probability for certain variable categories). Nonetheless, the aim of the sensitivity analysis was to quantify the extent to which small changes in the sample distribution of important variables such as smoking behavior, BMI, and some dietary habits may have affected the prevalence of metabolic syndrome components. Therefore, these values actually represent a set of possible sample characteristics by means of which plausible changes in the distribution of metabolic syndrome components can be estimated.
3. Results
3.1 Descriptive statistics
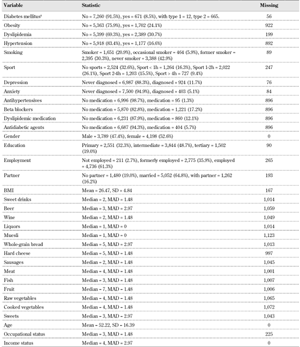
Descriptive statistics of the sample are provided in Table 2. Regarding the prevalence of single components of the metabolic syndrome, it can be observed that dyslipidemia and obesity were the most common symptoms in the sample in comparison to hypertension and diabetes. However, these single prevalence rates can more appropriately be interpreted by taking into account that the metabolic syndrome is defined in terms of co-occurrence of components. Although in the present investigation the definitional criteria of the IDF and AHA/NHLBI joint statement could not be applied (see methods section), it is still possible for descriptive purposes to define the metabolic syndrome as the presence of two out of four criteria considered in this investigation (diabetes, obesity, dyslipidemia, and hypertension). Thereby, comorbidity rates for each metabolic syndrome component can be estimated and compared.
Table
2.
Descriptive statistics: proportions for categorical variables (%), mean (continuous variables), median (ordinal variables), median absolute deviation (MAD), and number of missing data per variable (n = 7,987) |
|
 |
|
Legend:
a Information on diabetes type is supplied by the variable KHdiabtyp from the public use file. Note that the frequencies supplied in the variable KHdiab (yes = 671) differ from those of the KHdiabtyp variable (type I + type II diabetes = 677). In the present investigation, the variable KHdiab only is used in the regression analysis, as described in Table 1. |
|
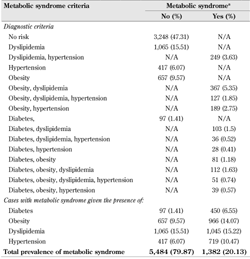
In Table 3, comorbidity rates of diabetes, obesity, dyslipidemia, and hypertension are reported. Among participants with dyslipidemia the ratio of cases with and without co-occurrence of other metabolic syndrome components is about 1:1, whereas the corresponding ratio among participants with diabetes is almost 1:5, even though the prevalence rate of dyslipidemia alone is the highest among all diagnostic criteria (compare Tables 2 and 3). This result suggests that comorbidity rates among diabetics are much greater than among individuals suffering from other metabolic syndrome components.
Table
3.
Prevalence rates of the metabolic syndrome by diagnostic criteria in the complete-case dataset (n = 6,866) |
|
 |
|
Legend:
Frequencies and proportions (%) reported. a Metabolic syndrome means the presence of two or more metabolic syndrome components, as described in Table 1. N/A = not applicable by definition. |
|
3.2 Regression models
The results of the regression analysis described in the methods section are presented in Table 4. The odds ratios of the socioeconomic models reveal that higher educational level, higher income, and occupational status were associated with lower prevalence rates of the metabolic syndrome. On the other hand, married and retired respondents had increased odds for each metabolic syndrome component in comparison with unemployed and respondents without a life partner.
Table
4.
Results of the regression analysis |
|
 |
|
In relation to the research hypothesis, the following can be observed in the results obtained from the fully adjusted models: the odds ratio estimates of the socioeconomic variables are subject to large mediation effects resulting from the consideration of health-related behaviors, potential health risks, and dietary habits. For instance, if the odds ratio estimates of the socioeconomic models and the fully adjusted models in Table 4 are compared, it can be seen that the strength of association for education, income status, and life partner are reduced or reversed in the complete-case and imputed dataset. At the same time, the large odds differences seen among formerly employed in comparison to unemployed respondents seem to be partially mediated by the whole set of mediators (e.g. from 4.73 to 1.37, see Table 4).
Whereas increased physical activity (at least more than 2 hours per week) was associated with a substantial decrease in odds, the estimates obtained for smoking behavior were contradictory, and depended on whether the complete-case or the imputed dataset was considered. Estimates obtained with the complete-case dataset suggested that former smokers had a higher metabolic syndrome prevalence than current smokers. In contrast, the odds ratios calculated from the imputed datasets revealed that both former smokers and never-smokers were associated with greater health-adverse odds than current smokers.
Regarding the odds ratio estimates of dietary habits, the results obtained with the complete-case and imputed dataset also differed to some extent. However, a more frequent consumption of wine, muesli, hard cheese, and fruits was generally associated with decreased prevalence of metabolic syndrome components in both models. In contrast, increases in odds were consistently observed for liquors, whole-grain bread, sausages, and meat.
Even though the effect sizes in all food groups may seem to be quite small, it should be recalled that the original responses to dietary habits were given on an ordinal 11-point scale. In fact, these associations had a similar order of magnitude as the odds ratios corresponding to age (OR 1.04 99% CI 1.04-1.04, imputed model in Table 4), and may have had a large impact on the overall odds. For instance, the median frequency of muesli consumption in the sample corresponded to the category 1 = "never" (see Table 2). According to Table 4, the odds ratio of muesli consumption is 0.97, with 99% CI 0.96-0.97. Thus, ceteris paribus, by increasing the frequency of muesli consumption to 1-2 times per week (i.e. category 4), an odds ratio of about 0.88 can be expected.
3.3 Predictive power and sensitivity analysis
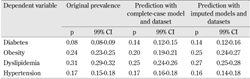
The predictive power of the fully adjusted regression models with complete-case and imputed datasets is reported in Table 5. Point estimates of the imputed datasets are closer to the original prevalence rates, albeit with some efficiency loss in comparison with the complete-case dataset. Predicted prevalence rates obtained for diabetes from the regression models tend to be higher than the observed ones (8% against 14% of the complete-case and imputed datasets, respectively).
Table
5.
Original vs. predicted prevalence rates (p) obtained from the fully adjusted models with complete case and imputed dataset |
|
 |
|
The results of the sensitivity analysis are reported in Table 6. The prevalence rates of the dataset used in the sensitivity analyses are reported in detail in the supplemental material. As stated in the methods section, sensitivity analyses were based on a random sample of 1000 observations from the complete-case dataset in which the sampling probability was reduced or increased depending on selected potential risk and protective factors, respectively. The expected changes in the predicted prevalence rates of metabolic syndrome components reported in Table 6 reveal that even small changes in the distribution of potential risk and protective factors can lead to reductions in prevalence rates. For example, muesli and fruit consumption, household income and percentage of respondents with a partner were only 1-2% higher than the correspondingly observed prevalence rates. The impact of these changes on the predicted prevalence rates suggest that about 2-3% average prevalence reduction could be attained for each one of the metabolic syndrome components (see Table 6).
Table
6.
Impact on predicted prevalence rates (p) of metabolic syndrome components obtained in the sensitivity analysis |
|
 |
|
4. Discussion
In the present investigation, the research hypothesis stated that the associations between the socioeconomic characteristics of individuals and the metabolic syndrome are (partially) mediated by:
- Health-related behaviors
- Physiological and psychosocial risk and/or protective factors
- The specific profile of dietary habits involving the frequency of fruit, vegetable, fiber, sweets, and alcoholic beverage consumption
Overall, the results of the regression analysis in the fully adjusted models confirmed this research hypothesis by the fact that almost all odds ratios corresponding to the socioeconomic variables were partially or fully mediated by consideration of appropriate covariates. In particular, having a life partner was an important factor leading to a substantial reduction in odds ratio estimates and providing evidence of the protective role social support might play regarding the syndrome. Furthermore, the associations between depression, anxiety, and metabolic syndrome (see Table 4) suggest that mental health states are important co-determinants in the etiology of the metabolic syndrome. The results concerning psychosocial factors such as having a life partner are thus in agreement with previous findings providing evidence on the negative association between social support and cardiovascular reactivity in response to stressors [35], and on increased risk of the metabolic syndrome among individuals with lifetime history or current major depressive episodes in prospective studies [36, 37]. Potential mechanisms responsible for the potential risk and/or protective role of psychosocial factors may be emotion-related physiological responses via endocrine and immune functions (e.g. activation of the sympathetic-adrenal-medullary and hypothalamic-pituitary-adrenal axes) [35, 38, 39].
Moreover, the results reported in Table 4 suggested that metabolic syndrome prevalence was lower in individuals with tertiary education, but not intermediate education, in comparison to those with primary education, even in the fully adjusted models. This fact may point to additional benefits of tertiary education in terms of increased knowledge of risk and/or protective factors or the relevance of several psychological processes affecting health outcomes (e.g. self-efficacy, emotion regulation, or problem-solving skills). For instance, self-efficacy has been related to increased physical activity and weight loss [40, 41], which are protective factors against the metabolic syndrome on their own. In a large Swedish prospective study, poor emotional control was not only associated with increased risk of coronary heart disease (hazard ratio 1.31 95% CI 1.18-1.45), but also more frequent among individuals with low education [42].
Since the odds ratio estimates regarding employment were given in relation to those respondents who have never been employed, the results suggested that the increased odds of metabolic syndrome among the employed population may have been related to factors concerning work conditions (e.g. work-related stressors, biomechanical, physical and/or chemical agents, etc.). For instance, previous findings in a South Korean sample indicated that shift work may be associated with increased metabolic syndrome prevalence [43].
Regarding the role of dietary habits on metabolic syndrome prevalence, the estimates reported in Table 4 were slightly contradictory between the models calculated with the complete-case and the imputed models. A consistent direction of effect sizes were obtained for wine, fruit, meat, liquors, whole-grain bread, hard cheese, sausages, and muesli consumption. It seems that a more frequent intake of fruits and muesli and, at the same time, a decrease in liquors and meat consumption were associated with decreased prevalence of metabolic syndrome components. Since contradictory results between regression models with the complete-case and imputed datasets were also observed for smoking behavior (see Table 4), item non-response effects may have probably been responsible for the inconsistencies observed for food consumption profiles. Given that the imputed datasets took into account 301 different variables, it is likely that the estimates obtained with the imputed datasets controlled for health-related response tendencies, and were thus much more reliable estimates of the true associations. Hence, if the odds ratio estimates of the imputed datasets were to be preferred, frequent wine, muesli, fruit, and raw vegetable consumption were associated with lower prevalence rates of the metabolic syndrome.
The results of the imputed models also agree well with previous research indicating that a frequent consumption of red and processed meat increased the risk of the metabolic syndrome [5, 44]. In relation to alcohol consumption, previous results of a large prospective cohort study in Brazil suggested a positive association for frequent beer consumption (outside of meals) and a negative association for wine consumption during meals (1-4 drinks per week) with metabolic syndrome incidence, respectively [45]. Similar results were obtained in a study with a large sample in the USA suggesting a J-shaped alcohol-mortality association, whereby moderate wine consumption may have led to lower levels of cardiovascular disease [46]. Results from a recent meta-analysis of six prospective studies found similar risk reductions for moderate drinkers (relative risk 0.86 95% CI 0.75-0.99) [47]. Several potential mechanisms accounting for the protective effect of moderate alcohol consumption included improved endothelial function [48], reduction of inflammatory reactions (e.g. interleukin 6 and 10, C-reactive protein) [49], reduced oxidative stress, and increased HDL levels [50].
Odds ratio estimates obtained for the role of smoking behavior differed substantially between the complete-case and imputed models. The results from the imputed models suggested that former and never-smokers had increased odds of metabolic syndrome. In contrast, odds ratio estimates of smoking behavior in the complete-case dataset suggested that only occasional smokers had increased syndrome prevalence, with no differences observed between current smokers and never-smokers. As stated above, the results of the imputed models were to be preferred given that they took into account potential confounding effects of item non-response tendencies. Even though smoking is a known risk factor for cardiovascular disease [51], its role in the incidence of the metabolic syndrome in terms of co-occurrence of several health-adverse outcomes seems to be more complex. For instance, Kim et al. (2009) reported a higher risk among former smokers than among sustained smokers in a longitudinal study in South Korea [52]. A lower risk of newly-diagnosed type 2 diabetes among current smokers has been reported in a large case-control study in China [53]. Similarly, Nagaya et al. (2007) report a moderate increase in risk among obese heavy smokers, but risk reductions among lean men in comparison to never smokers [54]. Therefore, the results of the imputed models of the present study suggested that the association between smoking and metabolic syndrome was not linear and may have been mediated by other factors. Even though smoking cessation among former smokers could have been due to the diagnosis of single metabolic syndrome components, the fact that odds ratio estimates were adjusted for medication suggested that this mechanism did not fully explain the observed variance. Unfortunately, the dataset available to the author did not allow a more detailed causal analysis of this association. Future studies with longitudinal data are necessary to confirm or reject these findings, and evaluate other potential mechanisms explaining the observed associations.
As stated in the introduction section, statistical inferences in the present investigation are related to the DEGS1 respondents and not to the whole German population because of the low response rate of 42%. Prevalence rates of the metabolic syndrome obtained from other large studies conducted in Germany report to some extent similar results for diabetes mellitus [55], dyslipidemia (≥250 mg/100 ml), obesity [56], depression, anxiety [57], and stage-1 hypertension [58]. Discrepancies between prevalence estimates are commonly related to sampling design, population, definition of variables, and year of data collection. Hypertension estimates may differ considerably depending on whether a history of hypertension is included and/or whether both systolic and diastolic blood pressure values are considered. In the present investigation, only systolic pressure was considered to reduce the higher number of missing values which arise by combining both blood pressure values (822 vs. 1,212 missing values and 16.7% vs. 13.7% prevalence rates, respectively). However, since the fully adjusted regression models took into account whether respondents received anti-hypertensive therapy or not, information on past or current hypertension was controlled for to some extent in the present study.
Prevalence estimates of the metabolic syndrome and some odds ratio estimates among specific variables obtained in the present investigation (see Table 3) agreed well with previous findings. Neuhauser and Ellert (2008) using data from the German National Health Interview and Examination Survey (NHIES) 1998 (n = 7,124) estimated a prevalence rate of the metabolic syndrome of about 13.3% on the basis of the classification scheme of the Expert Panel on Detection, Evaluation, and Treatment of High Blood Cholesterol in Adults [59]. Furthermore, by considering HbA1c cut-off values of >6.1% and >6.0%, the authors were able to classify ambiguous cases and perform sensitivity analysis leading to prevalence rates of the metabolic syndrome of 20.0% and 22.5%, respectively. Moreover, the odds ratio estimates corresponding to the variable age reported by Neuhauser and Ellert (2008) are similar to the estimates reported in the present investigation in spite of the differences in definitional criteria. For instance, Neuhauser and Ellert (2008) estimated the odds of metabolic syndrome among individuals in the age interval 70-79 to be 4.6 (95% CI 3.4-6.3). In the present investigation, the corresponding odds ratio would have been about 5.4 obtained by using the odds ratio estimate of 1.03, as reported in Table 4, and multiplying the logits by 57 years (i.e. the age range 75 years minus 18 years).
Predicted diabetes prevalence in Table 5 was found to be almost twice the observed prevalence rates (14% vs. 8%, respectively). This finding could be due to some underestimation of diabetes prevalence in the DEGS1 sample. For instance, prevalence rates of diabetes mellitus obtained in another study with a large sample of patients (n = 55,518) in the primary care sector were 14.7% (type 2) and 0.5% (type 1) [60]. Finally, the sensitivity analysis provided evidence that prevention strategies for the metabolic syndrome should include primary prevention measures, involving dietary habits and health-related behaviors, and secondary prevention strategies targeting individuals suffering from the condition. The estimated impact of slight prevalence changes of risk and protective factors reported in Table 6 (see also supplemental material) suggested that a coordinated prevention approach fostering small health-promoting modifications at different intervention levels (individual, societal, etc.) may have effected a measurable reduction in metabolic syndrome prevalence. Within this context, the present investigation provides further evidence that a Mediterranean-like diet characterized by frequent consumption of dietary fiber, fruits, vegetables, and moderate intake of wine may be an effective primary prevention factor for the reduction of metabolic syndrome, especially of (type 2) diabetes as the factor with highest comorbidity rates (see Table 3) [61-63].
5. Strengths and limitations
The first limitation of the present investigation is the cross-sectional design of the study. In particular, causal statements are limited regarding the specific patterns of temporal relationships of the associations, i.e. to what extent feedback or reverse causation processes affect the magnitude of associations and their interpretation [64]. However, it should be noted that the present investigation did not attempt to disentangle the temporal dynamics of reverse causality, but to test the mediation hypothesis of biologically plausible pathways responsible for the association between socioeconomic characteristics and the prevalence of metabolic syndrome components. Given the fact that the presence or absence of medical treatment for each metabolic syndrome component was taken into account in the regression models, the odds ratio can be interpreted as the marginal effects of socioeconomic characteristics, health-related behaviors, risk factors, and dietary habits on the frequency of metabolic syndrome components. The odds ratio estimates had taken into account the fact that some individuals may have already been diagnosed with the disease and, therefore, provided evidence of the direction of associations, i.e. whether the corresponding variable marginally increased or decreased the odds of metabolic syndrome prevalence.
The second major limitation is due to the fact that the DEGS1 public use file available to the author did not allow the definition of the metabolic syndrome according to the IDF-AHA/NHLBI joint statement. As a consequence, essential criteria such as HDL levels, triglycerides, fasting glucose levels, and elevated waist circumference could not be taken into account. Thus, a direct comparison of results obtained in the present investigation with those obtained on the basis of other diagnostic criteria of the metabolic syndrome is limited. However, previous findings based on different classifications of the metabolic syndrome agree to some extent with the present results. For example, Lindfeldt et al. (2003) used the following cut-off values for positive screening of the metabolic syndrome:
- Capillary blood glucose ≥ 8.0 mmol/l
- Serum triglycerides ≥ 2.3 mmo/l
- BMI ≥ 30 kg/m2
- Waist-to-hip ratio ≥ 0.90
- Blood pressure ≥ 160 and/or 95 mmHg
In agreement with the present investigation, the authors reported that low to moderate alcohol consumption and higher education were associated with lower odds ratios in relation to one or more metabolic syndrome components [19]. Finally, some recall bias due to self-reported information on diagnosed illnesses cannot be ruled out in spite of the fact that interviews in the DEGS1 study were conducted by physicians trained for the purposes of the survey.
On the other hand, the present study has several strengths. The efficiency and robustness of the regression analyses were enhanced by performing a comprehensive multiple imputation procedure based on 301 additional variables. To the best of the author's knowledge, this is the first study to make use of a multivariate regression analysis which appropriately takes into account the statistical dependence of metabolic syndrome components. Therefore, the odds ratio estimates obtained capture the (marginal) associations of single covariates with the metabolic syndrome as a whole. Furthermore, both the formulation of the research hypothesis and the specification of the regression analysis were based on a theoretical causal model which defines plausible biological and psychosocial pathways linking socioeconomic characteristics and metabolic syndrome components. Given the fact that the regression models were not modified a posteriori, the results reported in the present study support the validity of the theoretical model presented in the introduction section since the likelihood of statistical artifacts deriving from the so-called multiple modeling can be considered low.
6. Conclusions
Metabolic syndrome components were much less frequent among individuals with a higher educational level, higher income and occupational status, and those having a life partner. These associations point to protective effects of social support, improved work conditions, and education related to the development of metabolic syndrome components. The associations of socioeconomic characteristics were partially or fully mediated by health-related behaviors, physiological and psychosocial risk and/or protective factors, and dietary habits. Sensitivity analyses suggested that even small changes in the distribution of risk and protective factors may have reduced the prevalence of metabolic syndrome components.
Disclosures: The author reported no conflict of interests.
References
- Eckel RH, Grundy SM Zimmet PZ. The metabolic syndrome. The Lancet 2005. 365(9468):1415-1428. [DOD] [CrossRef]
- Alberti K, Eckel RH, Grundy SM, Zimmet PZ, Cleeman JI, Donato KA, Fruchart JC, James WP, Loria CM, Smith SC. Harmonizing the metabolic syndrome: a joint interim statement of the International Diabetes Federation Task Force on Epidemiology and Prevention; National Heart, Lung, and Blood Institute; American Heart Association; World Heart Federation; International Atherosclerosis Society; and International Association for the Study of Obesity. Circulation 2009. 120(16):1640-1645. [DOD] [CrossRef]
- Beltran-Sanchez H, Harhay MO, Harhay MM, McElligott S. Prevalence and trends of metabolic syndrome in the adult U.S. population, 1999-2010. J Am Coll Cardiol 2013. 62(8):697-703. [DOD] [CrossRef]
- Scuteri A, Laurent S, Cucca F, Cockcroft J, Cunha PG, Manas LR, Raso FU, Muiesan ML, Rylikyte L, Rietzschel E, et al. Metabolic syndrome across Europe: different clusters of risk factors. Eur J Prev Cardiol 2014. 22(4):486-491. [DOD] [CrossRef]
- Woo HD, Shin A Kim J. Dietary patterns of Korean adults and the prevalence of metabolic syndrome: a cross-sectional study. Plos One 2014. 9(11):e111593. [DOD] [CrossRef]
- Li R, Li W, Lun Z, Zhang H, Sun Z, Kanu JS, Qiu S, Cheng Y, Liu Y. Prevalence of metabolic syndrome in mainland China: a meta-analysis of published studies. BMC Public Health 2016. 16:296. [DOD] [CrossRef]
- Hu G. Prevalence of the metabolic syndrome and its relation to all-cause and cardiovascular mortality in nondiabetic European men and women. Arch Intern Med 2004. 164(10):1066. [DOD] [CrossRef]
- Gale EA. The myth of the metabolic syndrome. Diabetologia 2005. 48(9):1679-1683. [DOD] [CrossRef]
- Simmons RK, Alberti KG, Gale EA, Colagiuri S, Tuomilehto J, Qiao Q, Ramachandran A, Tajima N, Brajkovich Mirchov I, Ben-Nakhi A, et al. The metabolic syndrome: useful concept or clinical tool? Report of a WHO Expert Consultation. Diabetologia 2010. 53(4):600-605. [DOD] [CrossRef]
- Preiss D, Sattar N. Metabolic syndrome: collapsing under its own weight? Diabetic Medicine 2009. 26(5):457-459. [DOD]
- Reaven GM. Role of Insulin Resistance in Human Disease. Int Congr Ser 1988. 37(12):1595-1607. [DOD]
- Farooqui A. Metabolic syndrome. Springer 2013. [DOD]
- Di Cesare M, Khang YH, Asaria P, Blakely T, Cowan MJ, Farzadfar F, Guerrero R, Ikeda N, Kyobutungi C, Msyamboza KP, et al. Inequalities in non-communicable diseases and effective responses. Lancet 2013. 381(9866):585-597. [DOD] [CrossRef]
- Mackenbach JP, Bos V, Andersen O, Cardano M, Costa G, Harding S, Reid A, Hemström O, Valkonen T, Kunst AE. Widening socioeconomic inequalities in mortality in six Western European countries. Int J Epidemiol 2003. 32(5):830-837. [DOD] [CrossRef]
- Grundy SM. Diagnosis and management of the metabolic syndrome: an American Heart Association/National Heart, Lung, and Blood Institute scientific statement: executive summary. Circulation 2005. 112(17):e285-e290. [DOD] [CrossRef]
- Williams TR. Population and the socialization process part 1. Int J Environ Stud 1974. 7(1):27-36. [DOD] [CrossRef]
- Bandura A. Social foundations of thought and action: a social cognitive theory. Prentice, 1986. [DOD]
- Brunner EJ, Marmot MG, Nanchahal K, Shipley MJ, Stansfeld SA, Juneja M, Alberti KG. Social inequality in coronary risk: central obesity and the metabolic syndrome. Evidence from the Whitehall II study. Diabetologia 1997. 40(11):1341-1349. [DOD] [CrossRef]
- Lidfeldt J, Nyberg P, Nerbrand C, Samsioe G, Schersten B, Agardh CD. Socio-demographic and psychosocial factors are associated with features of the metabolic syndrome. The Women's Health in the Lund Area (WHILA) study. Diabetes Obes Metab 2003. 5(2):106-112. [DOD] [CrossRef]
- Santos AC, Ebrahim S, Barros H. Gender, socioeconomic status and metabolic syndrome in middle-aged and old adults. BMC Public Health 2008. 8:62. [DOD] [CrossRef]
- Ngo AD, Paquet C, Howard NJ, Coffee NT, Adams R, Taylor A, Daniel M. Area-level socioeconomic characteristics and incidence of metabolic syndrome: a prospective cohort study. BMC Public Health 2013. 13:681. [DOD] [CrossRef]
- Gannar F, Cabrera de Leon A, Brito Diaz B, Del Cristo Rodriguez Perez M, Marcelino Rodriguez I, Ben Dahmen F, Sakly M, Attia N. Social class and metabolic syndrome in populations from Tunisia and Spain. Diabetol Metab Syndr 2015. 7:88. [DOD] [CrossRef]
- Scheidt-Nave C, Kamtsiuris P, Gößwald A, Hölling H, Lange M, Busch MA, Dahm S, Dölle R, Ellert U, Fuchs J, et al. German Health Interview and Examination Survey for Adults (DEGS1) - design, objectives and implementation of the first data collection wave. BMC Public Health 2012. 12:730. [DOD] [CrossRef]
- Robert Koch Institut. German Health Interview and Examination Survey for Adults (DEGS1). Public Use File 1, 2015. [DOD]
- Dahm S, Domanska O, Kuhnert R, Richter A, Schaffrath A, Stolzenberg H, Wirz J. Studie zur Gesundheit Erwachsener in Deutschland (DEGS 1). Public Use File Dokumentation des Datensatzes. Robert Koch Institut 2015. [DOD]
- van Buuren S. Flexible imputation of missing data. CRC Press 2012. [DOD]
- Piepoli MF, Hoes AW, Agewall S, Albus C, Brotons C, Catapano AL, Cooney MT, Corra U, Cosyns B, Deaton C, et al. 2016 European guidelines on cardiovascular disease prevention in clinical practice. Eur Heart J 2016. 37(29):2315-2381. [DOD] [CrossRef]
- Brauns H, Scherer S, Steinmann S. The CASMIN educational classification in international comparative research. In: Hoffmeyer-Zlotnik J, Wolf C (Eds.). Advances in cross-national comparison. 2003, Kluwer, New York, pp. 221-244. [DOD]
- Lampert T, Kroll L, von der Lippe E, Müters S, Stolzenberg H. Measurement of socioeconomic status in the German Health Interview and Examination Survey for Adults (DEGS1). Bundesgesundheitsblatt 2013. 56(5-6):814-821. [DOD] [CrossRef]
- Ganzeboom H, De Graaf P, Treiman D. A standard international socio-economic index of occupational status. Soc Sci Res 1992. 21:1-56. [DOD] [CrossRef]
- Montano D. Multivariate hierarchical Bayesian models and choice of priors in the analysis of survey data. J Appl Stat 2016. In press. [DOD]
- Young SS, Karr A. Deming, data and observational studies. Significance 2011. 8(3):116-120. [DOD] [CrossRef]
- Ioannidis JP. Why most published research findings are false. Plos Med 2005. 2(8):e124. [DOD] [CrossRef]
- Cumming G. The new statistics: why and how. Psychol Sci 2014. 25(1):7-29. [DOD] [CrossRef]
- Uchino BN, Cacioppo JT, Kiecolt-Glaser JK. The relationship between social support and physiological processes: A review with emphasis on underlying mechanisms and implications for health. Psychol Bull 1996. 119(3):488-531. [DOD] [CrossRef]
- Goldbacher EM, Bromberger J, Matthews KA. Lifetime history of major depression predicts the development of the metabolic syndrome in middle-aged women. Psychosom Med 2009. 71(3):266-272. [DOD] [CrossRef]
- Pan A, Keum N, Okereke OI, Sun Q, Kivimaki M, Rubin RR, Hu FB. Bidirectional association between depression and metabolic syndrome: a systematic review and meta-analysis of epidemiological studies. Diabetes Care 2012. 35(5):1171-1180. [DOD] [CrossRef]
- Sapolsky RM, Romero LM, Munck AU. How do glucocorticoids influence stress responses? Integrating permissive, suppressive, stimulatory, and preparative actions. Endocr Rev 2000. 21(1):55-89. [DOD]
- Eisenberger NI. An empirical review of the neural underpinnings of receiving and giving social support: implications for health. Psychosom Med 2013. 75(6):545-556. [DOD] [CrossRef]
- Steptoe A, Rink E, Kerry S. Psychosocial predictors of changes in physical activity in overweight sedentary adults following counseling in primary care. Prev Med 2000. 31(2):183-194. [DOD] [CrossRef]
- Gallagher K, Jakicic J, Napolitano M, Marcus B. Psychosocial factors related to physical activity and weight loss in overweight women. Med Sci Sport Exer 2006. 38(5):971-980. [DOD] [CrossRef]
- Potijk MR, Janszky I, Reijneveld SA, Falkstedt D. Risk of coronary heart disease in men with poor emotional control. Psychosom Med 2016. 78(1):60-67. [DOD] [CrossRef]
- Yu KH, Yi YH, Kim YJ, Cho BM, Lee SY, Lee JG, Jeong DW, Ji SY. Shift work is associated with metabolic syndrome in young female Korean workers. Korean J Fam Med 2016. 38(2):51-56. [DOD]
- Tucker LA, LeCheminant JD, Bailey BW. Meat intake and insulin resistance in women without type 2 diabetes. J Diabetes Res 2015. 2015:1-10. [DOD]
- Vieira BA, Luft VC, Schmidt MI, Chambless LE, Chor D, Barreto SM, Duncan BB. Timing and type of alcohol consumption and the metabolic syndrome - ELSA-Brasil. Plos One 2016. 11(9):e0163044. [DOD] [CrossRef]
- Klatsky AL. Wine, liquor, beer, and mortality. Am J Epidemiol 2003. 158(6):585-595. [DOD] [CrossRef]
- Sun K, Ren M, Liu D, Wang C, Yang C, Yan L. Alcohol consumption and risk of metabolic syndrome: A meta-analysis of prospective studies. Clin Nutr 2014. 33(4):596-602. [DOD] [CrossRef]
- Hampton SM, Isherwood C, Kirkpatrick VJ, Lynne-Smith AC, Griffin BA. The influence of alcohol consumed with a meal on endothelial function in healthy individuals. J Hum Nutr Diet 2010. 23(2):120-125. [DOD] [CrossRef]
- Imhof A, Woodward M, Doering A, Helbecque N, Loewel H, Amouyel P, Lowe G, Koenig W. Overall alcohol intake, beer, wine, and systemic markers of inflammation in Western Europe: results from three MONICA samples (Augsburg, Glasgow, Lille). Eur Heart J 2004. 25(23):2092-2100. [DOD] [CrossRef]
- Urquiaga I, Leighton F. Wine and health: evidence and mechanisms. World Rev Nutr Diet 2005. 95:122-139. [DOD]
- Yusuf S, Hawken S, Ounpuu S, Dans T, Avezum A, Lanas F, McQueen M, Budaj A, Pais P, Varigos J, Lisheng L. Effect of potentially modifiable risk factors associated with myocardial infarction in 52 countries (the INTERHEART study): case-control study. Lancet 2004. 364(9438):937-952. [DOD] [CrossRef]
- Kim BJ, Kim BS, Sung KC, Kang JH, Lee MH, Park JR. Association of smoking status, weight change, and incident metabolic syndrome in men: a 3-year follow-up study. Diabetes Care 2009. 32(7):1314-1316. [DOD] [CrossRef]
- Hou X, Qiu J, Chen P, Lu J, Ma X, Lu J, Weng J, Ji L, Shan Z, Liu J, et al. Cigarette smoking is associated with a lower prevalence of newly diagnosed diabetes screened by OGTT than non-smoking in Chinese men with normal weight. Plos One 2016. 11(3):e0149234. [DOD] [CrossRef]
- Nagaya T, Yoshida H, Takahashi H, Kawai M. Heavy smoking raises risk for type 2 diabetes mellitus in obese men; but, light smoking reduces the risk in lean men: a follow-up study in Japan. Ann Epidemiol 2008. 18(2):113-118. [DOD] [CrossRef]
- Heidemann C, Du Y, Schubert I, Rathmann W, Scheidt-Nave C. Prävalenz und zeitliche Entwicklung des bekannten Diabetes mellitus. Bundesgesundheitsblatt 2013. 56(5-6):668-677. [DOD] [CrossRef]
- Thefeld W. Verbreitung der Herz-Kreislauf-Risikofaktoren Hypercholesterinämie, Übergewicht, Hypertonie und Rauchen in der Bevölkerung. Bundesgesundheitsblatt 2000. 43(6):415-423. [DOD] [CrossRef]
- Wittchen HU, Müller N, Pfister H, Winter S, Schmidtkunz B. Affektive, somatoforme und Angststörungen in Deutschland - Erste Ergebnisse des bundesweiten Zusatzsurveys "Psychische Störungen". Gesundheitswesen 1999. 61(Sonderheft 2):S216-S222. [DOD]
- Tham M. Blutdruck in Deutschland - Zustandsbeschreibung und Trends. Gesundheitswesen 1999. 61(Sonderheft 2):S90-S94. [DOD]
- Neuhauser H, Ellert U. Estimation of the metabolic syndrome prevalence in the general population in Germany. J Public Health 2008. 16(3):221-227. [DOD] [CrossRef]
- Pittrow D, Stalla Gü K, Zeiher AM, Silber S, März W, Pieper L, Klotsche J, Glaesmer H, Ruf G, Schneider HJ, Lehnert H, Böhler S, Koch U Wittchen HU. Prävalenz, medikamentöse Behandlung und Einstellung des Diabetes mellitus in der Hausarztpraxis. Med Klin 2006. 101(8):635-644. [DOD] [CrossRef]
- Serra-Majem L, Roman B, Estruch R. Scientific Evidence of Interventions Using the Mediterranean Diet: A Systematic Review. Nutr Rev 2006. 64:S27-S47. [DOD] [CrossRef]
- Mente A, de Koning L, Shannon HS, Anand SS. A systematic review of the evidence supporting a causal link between dietary factors and coronary heart disease. Arch Intern Med 2009. 169(7):659. [DOD] [CrossRef]
- Sofi F, Abbate R, Gensini GF, Casini A. Accruing evidence on benefits of adherence to the Mediterranean diet on health: an updated systematic review and meta-analysis. Am J Clin Nutr 2010. 92(5):1189-1196. [DOD] [CrossRef]
- Hill AB. The environment and disease: association or causation? J Roy Soc Med 1965. 108(1):32-37. [DOD] [CrossRef]
|


)
)
)
)
)
)
)