Original Data
| Rev Diabet Stud,
2005,
2(1):19-26 |
DOI 10.1900/RDS.2005.2.19 |
Proteomic Identification and Immunolocalization of Increased Renal Calbindin-D28k Expression in OVE26 Diabetic Mice
Visith Thongboonkerd1,2, Shirong Zheng3, Kenneth R. McLeish1,4,5, Paul N. Epstein3,6, Jon B. Klein1,4,5
1Core Proteomics Laboratory, Kidney Disease Program, Department of Medicine, University of Louisville, Louisville, KY, USA.
2Medical Molecular Biology Unit, Office for Research and Development, Faculty of Medicine at Siriraj Hospital, Mahidol University, Bangkok, Thailand.
3Department of Pediatrics, University of Louisville, Louisville, KY, USA.
4Veterans Affairs Medical Center, Louisville, KY, USA.
5Department of Biochemistry and Molecular Biology, University of Louisville, Louisville, KY, USA.
6Department of Pharmacology and Toxicology, University of Louisville, Louisville, KY, USA.
Address correspondence to: Visith Thongboonkerd, e-mail: thongboonkerd@dr.com.
Keywords: proteomics, proteome, proteomic analysis, kidney, diabetic nephropathy, diabetes, calbindin-D28k, calcium, vitamin D, renal tubules
Abstract
Diabetic nephropathy is a common diabetic complication that is associated with alterations in the expression of several renal proteins and abnormal calcium homeostasis. We performed proteomic analysis to screen for global changes of renal protein expression in diabetic kidney. Proteins extracted from the whole kidney of 120-day-old OVE26 (a transgenic model of Type 1 diabetes) and FVB (non-diabetic background strain) mice were separated by two-dimensional polyacrylamide gel electrophoresis (2-D PAGE) and visualized by SYPRO Ruby staining (n = 5 in each group). Quantitative intensity analysis revealed 41 differentially expressed proteins, of which 30 were identified by matrix-assisted laser desorption/ionization-time-of-flight mass spectrometry (MALDI-TOF MS) followed by peptide mass fingerprinting. One of the altered proteins with the greatest magnitude of change was the calcium-binding protein, calbindin-D28k, whose expression was increased 6.7-fold in diabetic kidney. We confirmed the increase in calbindin-D28k expression in diabetic kidney by Western blot analysis. Immunohistochemical study demonstrated that calbindin-D28k expression was markedly increased in tubular epithelial cells of distal convoluted tubules (DCT), collecting ducts (CD), and proximal convoluted tubules (PCT) in diabetic kidney. Calbindin-D28k plays a critical role in maintaining calcium homeostasis. The elevation in renal calbindin-D28k expression in our model may indicate a compensatory mechanism to overcome hypercalciuria in diabetes.
Introduction
Diabetic nephropathy is a major diabetic complication and accounts for more than 40% of cases with end-stage renal disease [1]. The number of diabetic patients with renal failure is expected to increase in the coming years. Common histopathological changes in diabetic nephropathy can affect all intrarenal structures, including glomeruli, tubulointerstitium, and blood vessels [2, 3]. All these changes accompany alterations in many different proteins, leading to decreased renal function and ultimately renal failure. Diabetes is also associated with altered Ca2+ homeostasis, characterized by hypercalciuria, decreased plasma 1,25-dihydroxy-vitamin D3 (1,25(OH)2D3), and osteopenia [4-9]. This metabolic complication is more common in type 1 (insulin-dependent), especially in long-standing cases who require high-dose insulin [10]. To date, the pathogenic mechanisms of this diabetic complication remain unclear and alterations in kidney proteins may play a pivotal role in this metabolic derangement as the kidney is one of the major organs that maintain Ca2+ homeostasis. Global analysis of alterations in renal protein expression during diabetes may lead to better understanding of the pathogenesis and pathophysiology of these diabetic renal complications.
We performed gel-based proteomic analysis to examine the renal proteome of diabetic OVE26 transgenic mice, which display many characteristics of Type 1 diabetes, compared to non-diabetic FVB background strain (n = 5). In the OVE26 diabetic model, diabetes occurs due to overexpression of calmodulin in pancreatic β-cells that causes metabolic derangements, including hyperglycemia, hypoinsulinemia, and hypertriglyceridemia [11, 12]. The OVE26 diabetic mice have polyuria, albuminuria, and renal histopathological changes that provide the best rodent model for simulating human diabetic nephropathy [13]. Initial proteomic analysis revealed 41 differentially expressed proteins in diabetic kidney [14]. In the present communication, we describe identification of calbindin-D28k as a highly regulated protein in diabetic nephropathy and demonstrate that the strikingly increased calibindin-D28k expression occurs in renal tubular epithelial cells of DCT, CD, and PCT. These findings may indicate a compensatory mechanism to overcome hypercalciuria in diabetes.
Methods
The initial production, characterization, and maintenance of the diabetic OVE26 line were performed as described previously [11, 12]. Control or non-diabetic mice were from a non-transgenic FVB background strain. Ten animals (5 in each group) at 120 days of age were studied. Renal proteins derived from a whole kidney from each animal were separated and visualized on individual 2-D gel. Quantitative and statistical analyses were performed to determine differential protein expression. All animal studies were approved by the University of Louisville Institutional Animal Care and Use Committee and were in accordance with the NIH Guide for the Care and Use of Laboratory Animals.
Extraction of Renal Proteins
Mice were sacrificed by injection with Ketamine HCl/Xylazine HCl solution (Sigma Chemical Co., St. Louis, MO). Protein extraction from the whole kidney was performed as described previously [15, 16]. Briefly, the kidney was rapidly frozen in liquid nitrogen, ground to powder, resuspended in a buffer containing 50 mM Tris, 0.3% SDS, and 200 mM DTT, and incubated at 100 °C for 5 min. DNA and RNA were removed by a buffer containing 500 mM Tris, 50 mM MgCl2, 1 mg/ml DNase I, and 0.25 mg/ml RNase A. Excess salts were removed by TCA precipitation and the protein pellet was finally resuspended in a buffer containing 40 mM Tris, 7.92 M urea, 0.06% SDS, 1.76% ampholytes, 120 mM DTT, and 3.2% Triton X-100. Protein concentration was measured by spectrophotometry using the HP 8453 UV-visible system (Hewlett-Packard Company, Palo Alto, CA) and Bio-Rad Protein Assay (Bio-Rad Laboratories, Hercules, CA).
2-D PAGE Protein Separation
A tube-gel running system (Genomic Solutions Inc., Ann Arbor, MI) was employed for isoelectric focusing (IEF), using 100 mM sodium hydroxide as the cathode buffer and 10 mM phosphoric acid as the anode buffer. Pre-cast carrier ampholyte tube gels, pH 3-10, 1 mm x 18 cm, were prefocused with maximal 1,500 V and 110 μA per tube. Samples containing 100 μg total protein from individual animals were loaded into individual tubes and were focused for 17 h and 30 min to reach 18,000 volt-hours. After completion of the IEF, tube gels were extruded and incubated in premixed Tris/acetate equilibration buffer with 0.01% bromophenol blue and 50 mM DTT for 2 min before loading onto pre-cast 10% homogeneous 22 x 22 cm slab gels (Genomic Solutions Inc., Ann Arbor, MI). The upper running buffer contained 0.2 M Tris base, 0.2 M Tricine, and 0.4% SDS, and the lower running buffer was 0.625 M Tris/acetate. The second dimensional separation was performed with a maximum of 500 V and 20,000 mW per gel.
SYPRO Ruby Staining and Visualization
Separated proteins in slab gels were fixed with 10% methanol and 7% acetic acid for 30 min. The fixed solution was removed and 500 ml of SYPRO Ruby gel stain (Bio-Rad Laboratories, Hercules, CA) was added to each gel and incubated on a gentle continuous rocker in a dark room at room temperature for 18 h. A 12-bit camera with a UV light box system (Genomic Solutions Inc., Ann Arbor, MI) was used to visualize gel images with 1-sec controlled exposure time.
Quantitative Analysis of Protein Expression
Investigator HT analyzer (Genomic Solutions Inc., Ann Arbor, MI) software was used for the matching and analysis of protein spots. The principles of measuring intensity values by 2-D analysis software were similar to those of densitometric measurement. The average mode of background subtraction was used to normalize intensity value, which represents the relative amount of protein. After completion of the spot matching, the normalized intensity values of individual protein spots from each animal were then compared between groups using statistical analysis.
Statistical Analysis
Because the sample size was relatively small, the Exact mode of the Mann-Whitney Test by SPSS software v. 10.0 was used for statistical analysis. Spot intensities were compared between control and diabetic groups, and p < 0.05 were considered statistically significant. This significance level obtained by the Exact Test is based on the reassignment of a test statistic, which is more accurate than using the ordinary or asymptotic significance value, especially in the case of a small sample size [17]. The data were reported as mean ± SEM.
In-Gel Tryptic Digestion, MALDI-TOF MS, and Peptide Mass Fingerprinting
In-gel tryptic digestion and MALDI-TOF MS were performed using the techniques described previously [18]. Peptide mass fingerprinting was performed using the "ProFound" search engine (http://129.85.19.192/profound_bin/WebProFound.exe). The NCBI protein database was restricted to mammalian entries, and peptides were assumed to be monoisotopic, oxidized at methionine residues, and carbamidomethylated at cysteine residues. Up to 1 missed trypsin cleavage and 150-ppm mass tolerance (error window) were allowed for matching of peptide mass values. The Z score was calculated by a comparison of search results against estimated random match population and was a distance to the population mean in unit of standard deviation. A score greater than 1.65 was considered statistically significant (p < 0.05).
Western Blot Analysis
Renal proteins were mixed 1:1 with 2X Laemmli sample buffer and heated at 100 °C for 5 min, and 50 μg proteins were separated by 10% SDS-PAGE. Proteins were transferred onto a nitrocellulose membrane and non-specific bindings were blocked with 5 % milk/TTBS. The membrane was treated with mouse monoclonal anti-calbindin-D28k (Sigma Chemical Co., St. Louis, MO), 1:1,000 in 5% milk/TTBS at 4 °C overnight. Immunoreactive calbindin-D28k band was detected by autoradiography using horseradish peroxidase-conjugated antibody and chemiluminescent substrate. Quantitative intensity analysis was performed using a PDSI Densitometer (Amersham Bioscience, Piscataway, NJ).
Immunohistochemistry
Immunohistochemistry was performed on 5-μm-thick kidney sections from 6 individual animals (3 in each group). The sections were de-paraffinized, re-hydrated, and digested with 0.1% Trypsin/PBS at room temperature for 10 min. Non-specific bindings were blocked with 5% donkey serum in 0.2% Triton X-100/PBS at room temperature for 2 h. The sections were then incubated with rabbit polyclonal anti-calbindin-D28k (Sigma Chemical Co., St. Louis, MO), 1:500 in PBS at 4 °C overnight. Slides were washed 3 times with PBS before incubating with CyTM3-conjugated AffiniPure donkey anti-rabbit IgG (Jackson ImmunoResearch Laboratories Inc., West Grove, PA), 1:500 in PBS at room temperature for 2 h. After washing with PBS, immunoreactive protein was observed under fluorescence microscopy.
Results
Diabetes in OVE26 mice occurred within one week after birth and random plasma glucose levels were over 600 mg/dl from 10 weeks of age. Plasma insulin levels of adult OVE26 mice were reduced to approximately 30% of normal values [12]. The animals survived without insulin therapy or any other treatment for at least a year. They exhibited pronounced polyuria and significant albuminuria by 2 months of age [13]. Albuminuria coincided with an elevation in blood pressure as measured by tail cuff [13]. Measurement of fluorescein iso-thiocynate inulin clearance demonstrated that GFR increased significantly from 2 to 3 months of age but then decreased significantly after 5 months of age [13]. Renal histopathological changes observed in 120-day-old OVE26 diabetic mice were a thickening of glomerular basement membrane and glomerular hypertrophy [11]. There was no intrarenal leukocyte infiltration or tubulointerstitial injury observed in OVE26 diabetic mice at this age.
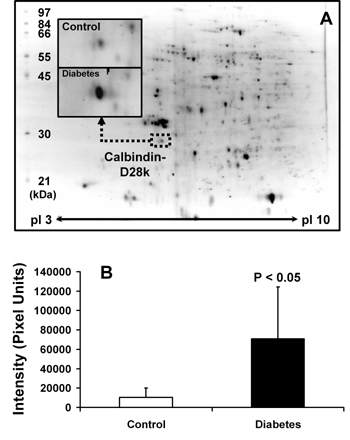
Renal proteins derived from a whole kidney from each animal were separated by 2-D PAGE and visualized by SYPRO Ruby staining on individual 2-D gels (n = 5 in each group). Protein spot pattern visualized on 2-D gels was reproducible and essentially identical among the individuals, as examined by 2-D analysis software. Approximately 300 protein spots were visualized on each gel (Figure 1A). By quantitative and statistical analyses, a total of 41 visualized protein spots were differentially expressed between the two groups [14]. These differentially expressed spots were then excised and subjected to in-gel tryptic digestion and identification by MALDI-TOF MS followed by peptide mass fingerprinting. From 41 differentially expressed spots, 30 were identified [14]. Positions of all proteins identified on 2-D gels were in the expected range of their theoretical isoelectric points and molecular sizes.
 |
 |
Figure 1. Proteomic identification of increased calbindin-D28k expression in diabetic kidney. A: Renal proteins derived from a whole kidney from each animal were separated by 2-D PAGE and visualized by SYPRO Ruby staining on individual 2-D gels (n = 5 in each group). Quantitative intensity analysis was performed to determine differential protein expression and differentially expressed proteins were identified by MALDI-TOF MS followed by peptide mass fingerprinting. One differentially expressed protein was calbindin-D28k, of which the expression level increased 6.7-fold in diabetic kidney (B). |
|
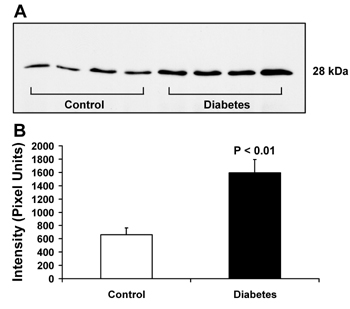
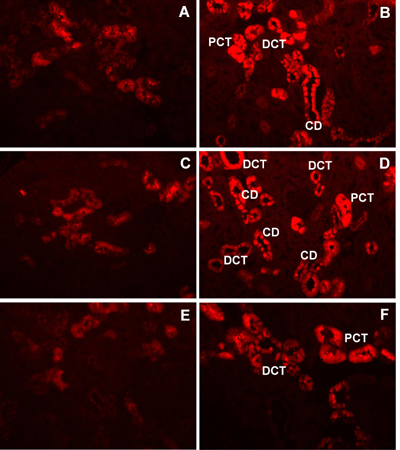
Among 30 identified proteins, we focused our attention on the change in renal expression of calbindin-D28k in the present study. Calbindin-D28k (NCBI identification number: gi|115396 and accession number: P07171) was identified as the altered protein with the greatest magnitude of change (6.7-fold increase: 70,654 ± 53,779 versus 10,538 ± 9,629 intensity units; p < 0.05; n = 5; Figures 1A and 1B). We confirmed our MALDI-MS-based proteomic data by Western blot analysis. Figure 2 clearly confirms that calbindin-D28k expression was increased in diabetic kidney and the magnitude of change was approximately 2.6-fold (1,594 ± 200 versus 660 ± 102 intensity units, p < 0.01; n = 4), as determined by densitometric analysis. Because proteomic and immunoblot data did not provide any information regarding localization of changes in protein expression, we performed an immunohistochemical study to localize the increase in calbindin-D28k expression in diabetic kidney. Figure 3 clearly demonstrates that renal calbindin-D28k expression was markedly increased in tubular epithelial cells of DCT, CD, and PCT in diabetic kidney.
 |
|
Figure 2. Western blot analysis for renal calbindin-D28k. A: Renal proteins derived from the whole kidney of OVE26 diabetic and FVB background mice (n = 4 in each group) were separated by 1-D PAGE and transferred onto a nitrocellulose membrane. The membrane was treated with mouse monoclonal anti-calbindin-D28k and immunoreactive protein was detected by autoradiography using horseradish peroxidase-conjugated antibody and chemiluminescent substrate. Only a single band at 28 kDa, the expected molecular size, was detected in each lane. Densitometric intensity analysis revealed the 2.6-fold increase of the calbindin-D28k level in diabetic kidney (B). |
|
 |
|
Figure 3. Immunolocalization of increased calbindin-D28k expression in diabetic kidney. After de-paraffinization, re-hydration, digestion and blocking, 5-μm-thick kidney sections were incubated with rabbit polyclonal anti-calbindin-D28k followed by incubation with CyTM3-conjugated AffiniPure donkey anti-rabbit IgG. Immunoreactive protein was observed under fluorescence microscopy. Panels A, C, and E were from FVB control mice (n = 3), whereas panels B, D, and F were from OVE26 diabetic mice (n = 3). Renal calbindin-D28k expression was markedly increased in tubular epithelial cells of distal convoluted tubules (DCT), collecting ducts (CD), and proximal convoluted tubules (PCT). Magnification power was 20X in all panels. |
|
Discussion
We performed gel-based proteomic analysis to screen for global changes in renal protein expression in diabetic kidney. One of the altered proteins with the greatest magnitude of change was calbindin-D28k, whose expression level increased 6.7-fold in diabetic kidney, as determined by 2-D proteomic analysis. Although MALDI-TOF MS followed by peptide mass fingerprinting is not a definitive protein identification method, we have frequently demonstrated that proteins identified by this method, with careful analysis using a vigorous scoring system to determine a significant hit (match), are consistent with those identified by other methods, especially 1-D and 2-D Western blot analyses [15, 16, 19-21]. In the present study, the MALDI-MS-based proteomic data were again confirmed by Western blot analysis. However, the magnitude of change in renal calbindin-D28k expression determined by Western blot analysis was only 2.6-fold. The difference in degree of changes between these two methods was most likely due to differential dynamic ranges between antibody-based detection and visualization using SYPRO ruthenium-based staining. Additionally, differences in imaging systems and quantitative software used should account for these different results.
Calbindin-D28k is generally known as a vitamin-D-dependent Ca2+-binding protein that plays an important role in renal tubular Ca2+ reabsorption [22]. In the normal kidney, calbindin-D28k distributes along DCT, connecting tubules and CD [23, 24], and co-localizes with epithelial Ca2+ channel, plasma membrane Ca2+-ATPase, and Na+/Ca2+ exchanger along 1,25(OH)2D3-responsive nephron segments [25]. These proteins regulate tubular Ca2+ reabsorption via an active transcellular Ca2+ transport process in the distal nephron [26]. The study by Christakos and colleagues [27] indicates that renal calbindin-D28k expression is probably the best marker for the 1,25(OH)2D3 activity. Renal calbindin-D28k appears to enhance tubular Ca2+ reabsorption, and a reduction of renal calbindin-D28k is associated with hypercalciuria [28-32]. Findings from a recent in vivo study using a gene-knockout model confirm the critical role of calbindin-D28k in maintaining renal calcium homeostasis [33]. Hypercalciuria is commonly associated with diabetes [4-9]. However, the number of studies addressing the pathophysiology of altered Ca2+ homeostasis during diabetes [7, 9, 34] is limited. The results from these studies clearly indicate that diabetic animals have hypercalciuria, decreased circulating 1,25(OH)2D3, and reduced bone mass. While hypercalciuria occurs, plasma levels of ionized and total Ca2+ can be maintained at normal levels in several study models [7, 9, 34]. These data implicate that a compensatory mechanism for diabetes-induced renal Ca2+ loss exists. In the present study, we show that the increased calbindin-D28k expression was prominent in the DCT and CD (1,25(OH)2D3-responsive nephron segments) of OVE26 diabetic mice. Considered together, these data suggest the hypothesis that the increase in renal calbindin-D28k in diabetic kidney may be one of the compensatory mechanisms responsive to diabetes-induced abnormal Ca2+ homeostasis [4-9].
Interestingly, the increase in renal calbindin-D28k expression localized not only in the distal nephron, where calbindin-D28k facilitates active Ca2+ reabsorption, but also in PCT, in which a role for calbindin-D28k is not clear. A recent study by Wu and colleagues [35] demonstrated that transfection of calbindin-D28k gene into murine proximal tubular epithelial cells provided protective effects against chemical hypoxic injury. Several other lines of inquiry indicate that calbindin-D28k has a cytoprotective role in preventing various cell types from cellular degeneration and apoptosis via a Ca2+-buffer mechanism [36-39]. Therefore, we speculate that calbindin-D28k may have another potential role in preventing apoptotic tubular cell death induced by diabetes.
There have been few previous studies that examined renal calbindin-D28k levels in diabetic models using primarily immunoblot methodology [7, 9, 40]. The results in those studies, however, were not conclusive and did not provide information about localization of changes. Ward and colleagues [9] recently reported that calbindin-D28k level in the whole kidney did not change in diabetic rats made diabetic with streptozotocin for 2 weeks. In the present study, we report a 6.7-fold increase in renal calbindin-D28k expression in 120-day-old OVE26 diabetic mice. The increase in renal calbindin-D28k was observed in tubular epithelial cells of DCT, CD and PCT, as determined by immunohistochemical analysis. At this age, the OVE26 mice had been diabetic for approximately 16 weeks. The greater duration of diabetes in our model may explain the difference in our results versus those reported by Ward et al. [9]. We recently performed proteomic analysis of the whole kidney from 120-day-old db/db diabetic mice. The data clearly confirmed that long-term diabetes causes increased renal calbindin-D28k expression (2.8-fold increase was observed in a db/db model of Type 2 diabetes).
In summary, we applied expression proteomics to define alterations in renal protein expression during diabetes. The greatest magnitude of change among differentially expressed proteins was for calbindin-D28k. Immunolocalization demonstrated that renal calbindin-D28k expression was increased in tubular epithelial cells along distal nephron segments and proximal convoluted tubules. These data may indicate a compensatory mechanism to normalize tubular calcium reabsorption in diabetes. Further systematic functional study, perhaps with a calbindin - D28k - transgenic and/or knockout model, is required to address our hypothesis.
Acknowledgments:
This study was supported by NIH R21 DK62086-01 (J.B.K.), NIH R01 HL66358-01 (J.B.K.), NIH R21 DK 06289 (K.R.M.), NIH HL62982 (P.N.E.), and the Department of Veterans Affairs (J.B.K. and K.R.M.).
References
- USRDS. Incidence and prevalence of ESRD. United States Renal Data System. Am J Kidney Dis 1997. 30:S40-S53. [DOD]
- Schleicher E, Kolm V, Ceol M, Nerlich A. Structural and functional changes in diabetic glomerulopathy. Kidney Blood Press Res 1996. 19:305-315. [DOD]
- Mauer SM, Lane P, Hattori M, Fioretto P, Steffes MW. Renal structure and function in insulin-dependent diabetes mellitus and type I membranoproliferative glomerulonephritis in humans. J Am Soc Nephrol 1992. 2:S181-S184. [DOD]
- Chau DL, Edelman SV, Chandran M. Osteoporosis and diabetes. Curr Diab Rep 2003. 3:37-42. [DOD]
- Selby PL. Osteopenia and diabetes. Diabet Med 1988. 5:423-428. [DOD]
- Malone JI, Lowitt S, Duncan JA, Shah SC, Vargas A, Root AW. Hypercalciuria, hyperphosphaturia, and growth retardation in children with diabetes mellitus. Pediatrics 1986. 78:298-304. [DOD]
- Verhaeghe J, Van Herck E, Visser WJ, Suiker AM, Thomasset M, Einhorn TA, Faierman E, Bouillon R. Bone and mineral metabolism in BB rats with long-term diabetes. Decreased bone turnover and osteoporosis. Diabetes 1990. 39:477-482. [DOD]
- Stone LA, Weaver VM, Bruns ME, Christakos S, Welsh J. Vitamin D receptors and compensatory tissue growth in spontaneously diabetic BB rats. Ann Nutr Metab 1991. 35:196-202. [DOD]
- Ward DT, Yau SK, Mee AP, Mawer EB, Miller CA, Garland HO, Riccardi D. Functional, molecular, and biochemical characterization of streptozotocin-induced diabetes. J Am Soc Nephrol 2001. 12:779-790. [DOD]
- Kayath MJ, Dib SA, Vieiaa JG. Prevalence and magnitude of osteopenia associated with insulin-dependent diabetes mellitus. J Diabetes Complications 1994. 8:97-104. [DOD] [CrossRef]
- Carlson EC, Audette JL, Klevay LM, Nguyen H, Epstein PN. Ultrastructural and functional analyses of nephropathy in calmodulin-induced diabetic transgenic mice. Anat Rec 1997. 247:9-19. [DOD] [CrossRef]
- Epstein PN, Overbeek PA, Means AR. Calmodulin-induced early-onset diabetes in transgenic mice. Cell 1989. 58:1067-1073. [DOD] [CrossRef]
- Zheng S, Noonan WT, Metreveli NS, Coventry S, Kralik PM, Carlson EC, Epstein PN. Development of Late-Stage Diabetic Nephropathy in OVE26 Diabetic Mice. Diabetes 2004. 53:3248-3257. [DOD]
- Thongboonkerd V, Barati MT, McLeish KR, Benarafa C, Remold-O'Donnell E, Zheng S, Rovin BH, Pierce WM, Epstein PN, Klein JB. Alterations in the renal elastin-elastase system in Type 1 diabetic nephropathy identified by proteomic analysis. J Am Soc Nephrol 2004. 15:650-662. [DOD] [CrossRef]
- Thongboonkerd V, Gozal E, Sachleben LR, Arthur JM, Pierce WM, Cai J, Chao J, Bader M, Pesquero JB, Gozal D et al. Proteomic analysis reveals alterations in the renal kallikrein pathway during hypoxia-induced hypertension. J Biol Chem 2002. 277:34708-34716. [DOD] [CrossRef]
- Arthur JM, Thongboonkerd V, Scherzer JA, Cai J, Pierce WM, Klein JB. Differential expression of proteins in renal cortex and medulla: a proteomic approach. Kidney Int 2002. 62:1314-1321. [DOD] [CrossRef]
- Berry KJ, Mielke PW Jr. Exact and Monte Carlo resampling procedures for the Wilcoxon-Mann-Whitney and Kruskal-Wallis tests. Percept Mot Skills 2000. 91:749-754. [DOD]
- Thongboonkerd V, Luengpailin J, Cao J, Pierce WM, Cai J, Klein JB, Doyle RJ. Fluoride exposure attenuates expression of Streptococcus pyogenes virulence factors. J Biol Chem 2002. 277:16599-16605. [DOD] [CrossRef]
- Thongboonkerd V, Klein JB, Pierce WM, Jevans AW, Arthur JM. Sodium loading changes urinary excretion: A proteomic analysis. Am J Physiol Renal Physiol 2003. 284:F1155-F1163. [DOD]
- Thongboonkerd V, Klein JB, Arthur JM. Proteomic identification of a large complement of rat urinary proteins. Nephron Exp Nephrol 2003. 95:e69-e78. [DOD] [CrossRef]
- Gozal E, Gozal D, Pierce WM, Thongboonkerd V, Scherzer JA, Sachleben LR, Zhang-Z G, Cai J, Klein JB. Proteomic analysis of CA1 and CA3 regions of rat hippocampus and differential susceptibility to intermittent hypoxia. J Neurochem 2002. 83:331-345. [DOD] [CrossRef]
- Sooy K, Kohut J, Christakos S. The role of calbindin and 1,25dihydroxyvitamin D3 in the kidney. Curr Opin Nephrol Hypertens 2000. 9:341-347. [DOD] [CrossRef]
- Borke JL, Caride A, Verma AK, Penniston JT, Kumar R. Plasma membrane calcium pump and 28-kDa calcium binding protein in cells of rat kidney distal tubules. Am J Physiol 1989. 257:F842-F849. [DOD]
- Biner HL, Arpin-Bott MP, Loffing J, Wang X, Knepper M, Hebert SC, Kaissling B. Human cortical distal nephron: distribution of electrolyte and water transport pathways. J Am Soc Nephrol 2002. 13:836-847. [DOD]
- Hoenderop JG, Hartog A, Stuiver M, Doucet A, Willems PH, Bindels RJ. Localization of the epithelial Ca(2+) channel in rabbit kidney and intestine. J Am Soc Nephrol 2000. 11:1171-1178. [DOD]
- Hoenderop JG, Nilius B, Bindels RJ. Molecular mechanism of active Ca2+ reabsorption in the distal nephron. Annu Rev Physiol 2002. 64:529-549. [DOD] [CrossRef]
- Christakos S, Gabrielides C, Rhoten WB. Vitamin D-dependent calcium binding proteins: chemistry, distribution, functional considerations, and molecular biology. Endocr Rev 1989. 10:3-26. [DOD]
- Koster HP, Hartog A, van Os CH, Bindels RJ. Calbindin-D28K facilitates cytosolic calcium diffusion without interfering with calcium signaling. Cell Calcium 1995. 18:187-196. [DOD] [CrossRef]
- Yang CW, Kim J, Kim YH, Cha JH, Mim SY, Kim YO, Shin YS, Kim YS, Bang BK. Inhibition of calbindin-D28K expression by cyclosporin A in rat kidney: the possible pathogenesis of cyclosporin A-induced hypercalciuria. J Am Soc Nephrol 1998. 9:1416-1426. [DOD]
- Grenet O, Bobadilla M, Chibout SD, Steiner S. Evidence for the impairment of the vitamin D activation pathway by cyclosporine A. Biochem Pharmacol 2000. 59:267-272. [DOD] [CrossRef]
- Grenet O, Varela MC, Staedtler F, Steiner S. The cyclosporine A-induced decrease in rat renal calbindin-D28kDa protein as a consequence of a decrease in its mRNA. Biochem Pharmacol 1998. 55:1131-1133. [DOD] [CrossRef]
- Aicher L, Meier G, Norcross AJ, Jakubowski J, Varela MC, Cordier A, Steiner S. Decrease in kidney calbindin-D 28kDa as a possible mechanism mediating cyclosporine A- and FK-506-induced calciuria and tubular mineralization. Biochem Pharmacol 1997. 53:723-731. [DOD] [CrossRef]
- Zheng W, Xie Y, Li G, Kong J, Feng JQ, Li YC. Critical role of calbindin-D28k in calcium homeostasis revealed by mice lacking both vitamin D receptor and calbindin-D28k. J Biol Chem 2004. 279:52406-52413. [DOD] [CrossRef]
- Anwana AB, Garland HO. Renal calcium and magnesium handling in experimental diabetes mellitus in the rat. Acta Endocrinol (Copenh) 1990. 122:479-486. [DOD]
- Wu MJ, Lai LW, Lien YH. Cytoprotective effects of calbindin-D(28k) against antimycin-A induced hypoxic injury in proximal tubular cells. Life Sci 2002. 71:559-569. [DOD] [CrossRef]
- Rabinovitch A, Suarez-Pinzon WL, Sooy K, Strynadka K, Christakos S. Expression of calbindin-D(28k) in a pancreatic islet beta-cell line protects against cytokine-induced apoptosis and necrosis. Endocrinology 2001. 142:3649-3655. [DOD] [CrossRef]
- Christakos S, Barletta F, Huening M, Dhawan P, Liu Y, Porta A, Peng X. Vitamin D target proteins: function and regulation. J Cell Biochem 2003. 88:238-244. [DOD] [CrossRef]
- Chard PS, Bleakman D, Christakos S, Fullmer CS, Miller RJ. Calcium buffering properties of calbindin D28k and parvalbumin in rat sensory neurones. J Physiol 1993. 472:341-357. [DOD]
- Guo Q, Sopher BL, Furukawa K, Pham DG, Robinson N, Martin GM, Mattson MP. Alzheimer's presenilin mutation sensitizes neural cells to apoptosis induced by trophic factor withdrawal and amyloid beta-peptide: involvement of calcium and oxyradicals. J Neurosci 1997. 17:4212-4222. [DOD]
- Hamilton K, Tein M, Glazier J, Mawer EB, Berry JL, Balment RJ, Boyd RD, Garland HO, Sibley CP. Altered calbindin mRNA expression and calcium regulating hormones in rat diabetic pregnancy. J Endocrinol 2000. 164:67-76. [DOD] [CrossRef]
This article has been cited by other articles:

|
Proteomics analysis reveals diabetic kidney as a ketogenic organ in type 2 diabetes
Zhang D, Yang H, Kong X, Wang K, Mao X, Yan X, Wang Y, Liu S, Zhang X, Li J, Chen L, Wu J, Wei M, Yang J, Guan Y
Am J Physiol Endocrinol Metab 2011. 300(2):E287-E295
|
|

|
Urinary proteome analysis for early diagnosis of diabetes and its complications
Zürbig P, Mischak H, Conrads S
Diabetes Stoffwechsel Herz 2009. 18(6):483-494
|
|

|
Do adenosine receptors offer new therapeutic options for diabetic nephropathy?
Martin RS, Valladares D, Roa H, Troncoso E, Sobrevia L
Curr Vasc Pharmacol 2009. 7(4):450-459
|
|

|
Application of proteomic techniques to the study of urine and renal tissue
Vilasi A, Cutillas PR, Unwin RJ
Proteomics Clin Appl 2008. 2(12):1564-1574
|
|

|
The urinary proteome in diabetes and diabetes-associated complications: New ways to assess disease progression and evaluate therapy
Rossing K, Mischak H, Rossing P, Schanstra JP, Wiseman A, Maahs DM
Proteomics Clin Appl 2008. 2(7-8):997-1007
|
|

|
Proteomic studies in animal models of diabetes
Resjo S, Berger K, Fex M, Hansson O
Proteomics Clin Appl 2008. 2(5):654-669
|
|

|
Outlook on Thailand's genomics and computational biology research and development
Tongsima W, Tongsima S, Palittapongarnpim P
PLoS Comput Biol 2008. 4(7):e1000115
|
|

|
Searching for Novel Biomarkers and New Therapeutic Targets of Diabetic Nephropathy Using Proteomics Approaches
Thongboonkerd V
Contrib Nephrol 2008. 160:37-52
|
|

|
Animal models of diabetes mellitus: relevance to vascular complications
Thompson CS
Curr Pharm Des 2008. 14(4):309-324
|
|

|
Proteomics for diabetes research: an update and future perspectives
Thongboonkerd V
Expert Rev Endocr Metabol 2006. 1(4):507-515
|
|
|


)
)
)