Original Data
| Rev Diabet Stud,
2004,
1(4):175-184 |
DOI 10.1900/RDS.2004.1.175 |
Differential Postprandial Lipoprotein Responses in Type 2 Diabetic Men with and without Clinical Evidence of a Former Myocardial Infarction
Marius Carstensen1, Claus Thomsen1, Ole Gotzsche2, Jens Juul Holst3, Jürgen Schrezenmeir4, Kjeld Hermansen1
1Department of Endocrinology and Metabolism C, Aarhus University Hospital, Aarhus Sygehus THG, Tage-Hansens Gade 2, DK-8000 Aarhus, Denmark.
2Department of Cardiology A, Aarhus University Hospital, Aarhus Sygehus THG, Tage-Hansens Gade 2, DK-8000 Aarhus, Denmark.
3Department of Medical Physiology, Panum Instituttet, University of Copenhagen, DK-2200 Copenhagen N, Denmark.
4Institute for Physiology and Biochemistry of Nutrition, Federal Dairy Research Centre, D-24103 Kiel, Germany.
Address correspondence to: Marius Carstensen, e-mail: mbc@dadlnet.dk
Keywords: lipoproteins, myocardial infarction, post-prandial period, triglycerides, type 2 diabetes
Abstract
Postprandial lipemia plays an important role in the development of coronary heart disease through an elevation of triglyceride-rich lipoproteins. In type 2 diabetic male subjects, our aim was to compare postprandial lipemia in a high-risk population with former myocardial infarction (MI) with that of a lower risk population free of clinically detectable heart disease. 32 male type 2 diabetic subjects were included in the study. We matched 17 cases with a verified history of MI with 15 controls according to age, BMI, HbA1c, diabetes duration, smoking, and treatment of diabetes. Ongoing metformin, insulin, or lipid lowering pharmacological treatment were exclusion criteria. After a maximal exercise tolerance test and echocardiography, the subjects underwent a hyperinsulinemic, euglycemic clamp and a vitamin A fat loading test. Plasma triglyceride levels in the case group were significantly higher after 360 minutes (4.6 ± 3.1 vs. 2.8 ± 1.8 mmol/l, p = 0.04) and 480 minutes (3.6 ± 2.2 vs. 2.4 ± 2.4 mmol/l, p = 0.03), as was the incremental Area Under the Curve (iAUC) for the whole period (560 ± 452 vs. 297 ± 214 mmolx480min./l; p = 0.048). In addition, the retinyl palmitate responses in the chylomicron-fraction from the case group were significantly higher (iAUC 311,502 ± 194,933 vs. 187,004 ± 102,928 ngx480min./ml; p = 0.035). Type 2 diabetic males with prior MI had higher postprandial triglyceride-rich lipoprotein responses than those without MI, indicating that high responses may be a marker for a high-risk population.
Introduction
The increased risk of cardiovascular disease, e.g. coronary artery disease (CAD), in type 2 diabetes is well recognized [1]. The 2- to 4-fold increased morbidity and mortality to cardiovascular disease in diabetes [1, 2] is associated with both diabetes-specific risk factors [3] and increased frequency of conventional risk factors for cardiovascular disease [4]. The absolute and relative mortality risks are greater once myocardial infarction (MI) has occurred [5, 6]. The prognosis of coronary heart disease in type 2 diabetic subjects without previous myocardial infarction may be comparable to the prognosis in non-diabetic subjects with prior myocardial infarction [5, 6], although this has recently been contested [7].
The diabetic dyslipidemia that is characterized by hypertriglyceridemia, low HDL-cholesterol and the accumulation of remnant and small dense LDL particles is one of the major risk factors contributing to cardiovascular disease in type 2 diabetes [8]. Plasma lipids and lipoproteins are generally measured in the fasting state, but in Western societies, most of our lives are spent in the postprandial state. In 1979, Zilversmit [9] put forward the hypothesis describing atherosclerosis as a postprandial phenomenon. Subsequent studies in non-diabetic subjects have confirmed that patients with angiographically verified CAD versus subjects without CAD have increased postprandial levels of triglyceride and intestinally-derived triglyceride-rich lipoproteins (TRL) (chylomicrons and their remnants) [10-14]. Little information exists on postprandial lipemia in type 2 diabetes with and without CAD. Syvanne et al. [15] were unable to distinguish type 2 diabetic patients with and without CAD on the magnitude of postprandial lipemia after an oral fat load. In a cross-sectional angiographic study in type 2 diabetes, the same group found delayed clearance of both hepatic and intestinal lipoproteins, however, without revealing any difference between a group with severe CAD and a group with mild CAD [16]. We hypothesize that diabetic men with a prior myocardial infarction (MI) have a more severe form of lipid metabolic derangement than men without MI, a feature that per se may contribute to the susceptibility to CAD. The present study was performed to compare postprandial lipemia in two matched groups of type 2 diabetic men with and without a verified previous MI.
Subjects and Methods
Subjects
Thirty-four type 2 diabetic men were recruited from the outpatients’ clinics at Aarhus University Hospital. They were all characterized as having type 2 diabetes according to the criteria given by WHO 1985 [17]. Cases had recovered from a myocardial infarction diagnosed on the basis of medical history, activities of cardiac enzymes (S-troponin T (TNT) or creatine kinase - myocardial band (CK-MB)), and/or appearance of Q waves and changes in ST or T segments on the electrocardiogram (ECG). Controls had no prior history of MI, negative maximal stress exercise ECG tests, and echocardiograms showing no sign of prior MI. Criteria of inclusion were: Caucasian origin; diabetes treated only with diet, Acarbose and/or sulfonylurea. Subjects with alcohol abuse or treated with lipid-lowering drugs were excluded. None of the patients had known diabetic complications except for background retinopathy and microalbuminuria.
One case subject withdrew his informed consent after the first visit and one control subject was excluded due to a positive stress exercise ECG. The two study groups subsequently contained 17 cases and 15 controls. Case and control subjects were matched according to age, Body Mass Index (BMI), glycated hemoglobin (HbA1c), diabetes duration, smoking, and treatment of diabetes. Seven case and two control subjects took ACE-antagonists. Seven case subjects took β-blockers. Seventeen case and two control subjects took acetylsalicylic acid. Five case and one control subject took calcium antagonists and loop diuretics. They took the prescribed medicine throughout the study and kept an unchanged dose of medicine. Usual morning medication was postponed until the test was completed.
The study was conducted in accordance with the Declaration of Helsinki, was approved by the local ethics committee, and all subjects gave their written informed consent before entering the study.
Study design
Subjects attended three study days. A standard ECG, a maximal stress exercise test, as well as an echocardiography, were performed at day one. At study day two, fasting and postprandial responses were measured after a fat-rich meal. On study day three, a euglycemic hyperinsulinemic clamp and a 24-hour ambulatory blood pressure measurement were carried out.
Methods
One experienced investigator performed all the echocardiographic examinations with a 2.5 MHz transducer and standard clinical ultrasound equipment. The investigator was unaware of patient history. The left ventricle ejection fraction was calculated by the method of Teichholz et al. [18] and given as the mean of 3 to 4 readings from M-mode echocardiograms. Further, a 9-segment wall motion index of the left ventricle was recorded in 2D-mode [19, 20]. A conventional 12-lead ECG was obtained, as well as a maximum exercise tolerance test. A standard protocol with an initial workload of 25 watts (W) and incremental increase in workload with 25 W every two minutes was used [21].
For three days preceding the oral vitamin A fat loading test, subjects ingested a high-carbohydrate diet provided by the dietitian. Food amounts corresponded to individual energy requirements [22]. Subjects fasted overnight from 22:00. Morning medication was postponed until after the test. On arrival, an indwelling catheter was inserted into an antecubital vein. The test meal was ingested at 08:00. The meal consisted of 150 ml non-caloric soup, 100 g salted butter (20 % water), 25 g sliced raw leek, and 94 g white bread. Total energy content was 1027 kcal with 77 E% fat, 20 E% carbohydrate, and 3 E% protein. Total fat amounted to 86.6 g (54.3 g saturated fat (SAFA), 21.9 g monounsaturated fat (MUFA), and 4.4 g polyunsaturated fat (PUFA)). Carbohydrate content was 51 g and protein 8 g. The meal contained 220 mg of cholesterol. The meal was ingested within 10 minutes and was served with 250 ml tap water. With the first spoonful of soup, the subjects took a standard dose of vitamin A (30 mg, 100,000 IU) in tablet form (Medic Team, Birkeroed, Denmark) as a means of quantifying lipoproteins of intestinal origin, i.e. chylomicrons and chylomicron remnants [23]. Ingestion of vitamin A causes retinyl ester labeling of chylomicrons [24]. Blood was sampled for measurements in plasma of glucose, insulin, free fatty acids (FFA), total cholesterol, triacylglycerol (TG), retinyl palmitate (RP), GLP-1, and GIP at pre-planned intervals for 8 hours. EDTA-samples were instantly put into ice in a closed box. Plasma was then immediately separated by centrifugation at 2300 x g for 10 minutes at 4°C and kept frozen at -80°C until analyzed or further subdivided by ultracentrifugation.
To separate lipoproteins, the EDTA plasma samples were subjected to a single ultracentrifugation step to divide the samples into chylomicron-rich and chylomicron-poor fractions according to the method previously described in detail [25]. Ambulatory blood pressure was measured by SpaceLabs model 90207 (Redmond, Washington, USA) [26]. Urine was collected for 24 hours.
An indwelling venous catheter for blood sampling was placed in the back of the left hand, which was heated in order to approximate arterialized blood values [27] and a hyperinsulinemic, euglycemic clamp was performed as described by DeFronzo [28]. The M-value (the rate of glucose infusion per kilo body weight during steady state [28]) was calculated from the glucose utilization during the 30 minutes steady state period.
Analytical methods
For typing of common apolipoprotein E isoforms (E2, E3, E4) we used a restriction enzyme isoform genotyping technique described by Hixson and Vernier [29]. Plasma glucose was measured by the glucose oxidase method. HbA1C was determined by a High-Pressure Liquid Chromatographic method by use of a monodisperse cation-exchanger (Pharmasia Mono-S column) (modified from [30]). The normal reference interval was 0.041 to 0.061. Triglycerides, total cholesterol, and HDL were measured on a Roche/Hitashi 917 Automatic analyzer (Roche Diagnostics GmbH, Mannheim, Germany). LDL was calculated.
Triacylglycerol, cholesterol (HDL cholesterol in the chylomicron-poor fraction only, after precipitation of apolipoprotein B-containing lipoprotein with phosphotungstic acid), and free fatty acids were measured with standard enzymatic colorimetric assays by using commercial kits (Wako Chemicals, Neuss, Germany, and Boehringer Mannheim, Mannheim, Germany). Retinyl esters were extracted and determined by isocratic adsorption high-performance liquid chromatography as described by Biesalski [31] and Schrezenmeir [32]. Serum insulin concentrations were measured by an enzyme-linked immunosorbent assay method (DAKO Diagnostics Ltd., Cambridgeshire, UK) [33]. GIP ("Glucose-dependent Insulinotropic Polypeptide" [34]) was measured by radioimmunoassay [35]. GLP-1 (Glucagon-like peptide-1) concentrations were measured as described by Hvidberg et al. [36] against standards of synthetic GLP-1 amide (proglucagon 78-107 amide) [37] by using an antiserum that mainly reacts with GLP-1 of intestinal origin [37].
Statistical analysis
The number of participants needed to obtain sufficient statistical power (i.e., > 0.8) was calculated a priori. Results are presented as cases versus controls (mean ± SD) with the exception of postprandial responses. Mean ± Standard Error of the Mean (SEM) as error bars is used here for clarity of presentation. When the data was consistent with the hypothesis of normality an unpaired t-test was used for statistical analysis; otherwise the Mann-Whitney Rank Sum Test was used. The number of individuals in contingency tables was analyzed by a Fisher Exact Test. Incremental areas under the curve (iAUC) correlating best to responses [38] were calculated using the trapezoidal rule from Matthews et al. [39]. One-way ANOVA (repeated measures) was applied to the responses of the subjects to the meal test. Statistical differences were then located using the Student-Newman-Keuls multiple comparisons test. Statistical analysis was done using SigmaStat for Windows version 2.03 (SPSS Inc. Chicago, Illinois, USA). P < 0.05 was considered statistically significant.
Results
Clinical characteristics
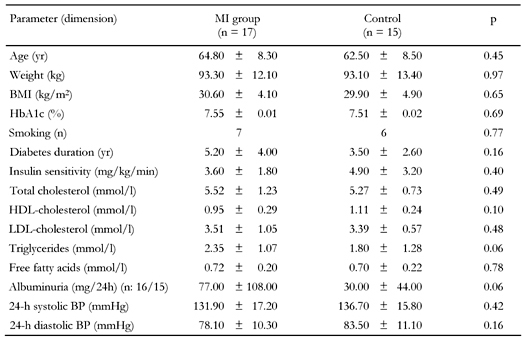
The clinical characteristics of the study groups are summarized in Table 1. Subjects were matched according to age, weight, BMI, HbA1c, smoking, and known diabetes duration for which we found no statistical differences. Insulin sensitivity measured by the hyperinsulinemic, euglycemic clamp did not differ significantly. Blood pressure was lower in the MI group, but the difference was not statistically significant.
Table
1.
Characteristics of the study groups |
|
 |
 |
Legend:
Data are means ± SD. MI: former myocardial infarction, n: number of patients, BP: blood pressure. p-values represent matching impact. |
|
Echocardiography and exercise stress ECG showed a clear distinction between the two groups. Cardiac characteristics of the study groups are summarized in Table 2. Oxygen uptake is expressed in multiples of resting energy requirements (METS). In the MI group, eight subjects had suffered a Q-wave MI and nine subjects a non-Q-wave MI from 4 months to 18 years (mean 5 years) previously. During the stress test, eight subjects developed significant ST-segment depression and three subjects developed angina, one without significant ST-segment depression. In the control group, one subject had a pathological Q-wave, but with no history and with no sequelae of MI to be found in echocardiography and stress ECG. No one in the control group developed angina or significant ST-segment depression. No significant differences in apolipoprotein E isoforms were found.
Table
2.
Cardiac characteristics of the study groups |
|
 |
|
Legend:
Data are means ± SD. METS: multiples of resting energy requirements. |
|
Urinary excretion of albumin differed significantly with 154 ± 334 vs. 30 ± 44 mg/24h (p = 0.04), but with the exclusion of one extreme outlier from the MI group, excretion of albumin only tended to be significant with 77 ± 108 vs. 30 ± 44 mg/24h (p = 0.06).
Lipids and lipoproteins (Figure 1)
Fasting cholesterol values are summarized in Table 1. Fasting free fatty acids did not differ. FFA responses differed only at a single point at 60 minutes (0.55 ± 0.09 vs. 0.42 ± 0.16 mmol/l (p = 0.02)). Fasting lipid and lipoprotein levels showed no significant difference. Although fasting triglycerides tended to differ, it did not reach statistical significance: 2.35 ± 1.07 vs. 1.80 ± 1.28 mmol/l (p = 0.06). Plasma triglyceride levels in the case group were significantly higher after 360 minutes (4.6 ± 3.1 vs. 2.8 ± 1.8 mmol/l (p = 0.04)) and 480 minutes (3.6 ± 2.2 vs. 2.4 ± 2.4 mmol/l (p = 0.03)), as were the iAUC for the whole period (559.9 ± 452.0 vs. 296.6 ± 214.4 mmolx480min/l (p = 0.048)).
 |
|
Figure 1. Eight-hour responses of P-triglyceride (A), free fatty acids (B), retinyl palmitate in the supernatant fraction (C), and retinylpalmitate in the infranatant fraction (D). Data are means ± SEM. Black circles = MI group. White circles = control group. * p < 0.05. |
|
In the supernatant fraction, triglyceride eight-hour response (iAUC) did not reach a statistically significant difference (408.5 ± 326.9 vs. 262.4 ± 173.2 mmolx480min/l (p = 0.22)), nor did triglyceride eight-hour response in the infranatant fraction (26.6 ± 32.3 vs. 26.6 ± 30.5 mmolx480min./l (p = 0.865)). Enrichment of the supernatant fraction with retinyl palmitate demonstrated a significantly higher response in the case group with an iAUC of 314,798 ± 200,837 vs. 187,004 ± 102,928 ngx480min./ml (p = 0.035). No significant difference was found in the infranatant fraction with an iAUC of 93,678 ± 51,102 vs. 77,132 ± 30,263 ngx480min/ml (p = 0.396).
Glucose and hormones (Figure 2)
No significant differences between the two groups were found in eight-hour responses measured as incremental area under the curve (iAUC) for glucose (p = 0.20) and insulin (p = 0.33). The insulin response presented a single significant difference at 240 min: 152.5 ± 63.3 vs. 100.8 ± 56.7 mmol/l (p = 0.02). No significant differences in iAUC for GIP (32,318 ± 13,226 vs. 29,478 ± 8,504 pmolx480min./l (p = 0.48)) and GLP-1 (7,559 ± 3,642 vs. 8,882 ± 6,831 pmolx480min./l (p = 0.49)) were found in 8-h responses.
 |
|
Figure 2. Eight-hour responses of glucose (A), insulin (B), glucagon-like peptide-1 (C), and glucose-dependent insulinotropic polypeptide (D). Data are means ± SEM. Black circles = MI group. White circles = control group. |
|
Discussion
The present study demonstrated that type 2 diabetic men with prior MI had significantly higher responses of plasma triglycerides and retinyl palmitate-labeled lipoproteins of intestinal origin in the CM-rich fraction to a fat rich meal than a matched group without prior MI. These results contrast with the studies of Syvanne et al. [15] and Mero et al. [16], indicating that abnormal metabolism of postprandial lipoproteins in patients with type 2 diabetes has no relationship to CAD.
Our study corroborates previous investigations in non-diabetic subjects with CAD exhibiting enhanced postprandial lipemia [10-14]. Furthermore, type 2 diabetic patients have raised levels of postprandial remnant lipoproteins compared to non-diabetic subjects [15, 16, 40]. A long residence time of TG-rich remnant particles in circulation has been demonstrated in type 2 diabetic subjects [15, 41], in which total AUC was highly correlated to fasting TG, whereas iAUC was correlated to the postprandial TG responses [38]. The postprandial TG-rich lipoprotein metabolism is closely coupled with LDL and HDL metabolism. The long residence time of remnant particles results in an increased exchange of the core lipid cholesteryl ester for TG between the TG-rich lipoprotein particles and LDL, and HDL cholesterol mediated by cholesteryl ester transfer protein (CETP). The process enriches LDL and HDL with TG, and hydrolysis by hepatic lipase results in smaller, denser LDL and HDL particles. This pattern further increases the risk of CAD in type 2 diabetes [15]. The major postprandial lipoprotein is the apo B48-containing chylomicron (CM) particle. Specific binding sites on the human monocyte/macrophage have recently been discovered [42], which suggests the existence of a mechanism that may explain the atherogenicity of these particles.
Syvanne et al. [15] and Mero et al. [16] found no apparent associations between CAD and postprandial lipemia in type 2 diabetic subjects. Syvanne et al. [15] suggested that the excessive alimentary lipemia in type 2 diabetic patients is to an equal extent present in individuals with and without CAD documented by coronary angiography showing at least 50% stenosis in one or more major coronary branches. The study of Mero et al. [16] corroborated these results showing that type 2 diabetic patients with mild and severe CAD verified angiographically have similar concentrations of postprandial apo B-48 and apo B-100-containing particles.
Various reasons for the contrasting results between their studies and ours may be provided e.g. by differences in a) our populations b) severity of CAD, c) diets and meal testing, d) medication, e) degree of matching of the control and case groups.
The subjects in Syvanne’s study [15] and ours were comparable regarding fasting glucose, HbA1c, apo E phenotype, and fasting cholesterol levels (total, LDL, and HDL). However, our subjects were about one decennium older and had a slightly higher BMI. Age is known to be an independent risk factor for MI [44] and both fasting triglycerides and LDL-cholesterol increase with age, based on elevated VLDL apo B-100 secretion and delayed LDL apo B-100 clearance [45]. Our case group might also have had more severe CAD with verified MI, which was not demonstrated for their CAD subjects [15, 16]. Haffner et al. [5] have shown that the seven-year incidence rates of MI in Finnish type 2 diabetic subjects with and without prior MI at baseline were 45.0 % and 20.2 %, respectively. If angiography or thallium scintigraphy had been carried out in our study, the possibility of a different degree of CAD would have been further clarified.
Surprisingly, Syvanne [15] found a tendency towards lower average fasting triglycerides in the DM+CAD+ group than in the DM+CAD- group (1.88 versus 2.17 mmol/l, NS) even though fasting HDL cholesterol implied an inverse relationship (1.08 versus 1.24 mmol/l, NS) quite comparable to our results. This could reflect that their case group might have changed diet according to cardio protective recommendations. Besides a 12-hour fast, Syvanne and Mero did not standardize dietary differences between the two groups. We provided a high-carbohydrate diet for three days preceding the meal test based on the findings that type 2 diabetic subjects then have only a very modest day-to-day variation in insulin sensitivity [46]. The fat loads were sufficient [47] and comparable providing 86.6 g fat in our regime, 78 g fat in the study of Syvanne [15], and about 50 g fat per surface square meter in Mero's study [16].
The effects of unselective β-blockers on total cholesterol or LDL-cholesterol are negligible while triglyceride levels may be increased (10 to 40 %) and HDL-cholesterol levels decreased (5 to 20 %) [48]. β1-selectivity is associated with a more neutral effect i.e. in a group of type 2 diabetic subjects metoprolol did not significantly change fasting metabolic variables [49]. Metoprolol treatment has been shown to enhance fasting and postprandial triglyceridemia in middle-aged non-diabetic men but did not significantly influence the postprandial responses of CM and CM remnants [50]. Most patients in the study of Syvanne [15] with CAD took β-blockers and several patients without CAD took metformin, which presumably should have exaggerated postprandial differences. In our study, seven out of 17 case patients took β-blockers (Metoprolol), whereas metformin treatment was an exclusion criterion.
A further reason for the contrasting results could be that their case and control groups were not too well matched [15, 16]. Independent of triglycerides, smoking is a strong predictor of postprandial lipemia [51] with substantially increased RP and apolipoprotein B-48 responses. Thus, smoking was not a matching criterion of Syvanne et al. [15]. In our study, as well as in the study of Mero et al. [16], no significant difference in smoking status was found. Fifty percent of the control group in the study of Mero [16] received insulin versus 22% of the case group (p = 0.060). In our study, insulin therapy was an exclusion criterion. It should also be noted that the glycemic control in the control group of Mero et al. was significantly worse than in the CAD group (mean HbA1c 8.4 versus 7.4 %, p = 0.007). In our study, cases and controls had similar HbA1c and the M-values were not statistically different. Furthermore, duration of diabetes was significantly longer (11 years versus 7 years, p = 0.04) in Mero's control group [16], which also had gender skewness with 50% females versus a nearly all male case group (p = 0.013), which both tend to reduce a possible difference. The metabolic control of type 2 diabetes and the duration of diabetes are important predictors of CAD in elderly subjects [52].
The responses of the duodenal incretin hormones glucagon-like peptide 1 (GLP-1) and gastric inhibitory polypeptide (GIP) showed no statistical difference between the MI and non-MI groups. GLP-1, which has an insulinotropic effect and is known to inhibit gastric emptying, is being investigated as a possible treatment of hyperglycemia in type 2 diabetes. A possible connection between the types of ingested fat in a test meal, the resulting postprandial triglyceridemia and the postprandial levels of incretins has been demonstrated earlier in healthy subjects [25] and in type 2 diabetic subjects [53].
Microalbuminuria is a risk factor for cardiovascular events. Our study corroborates the finding that the risk of cardiovascular events, e.g. MI, increases with the degree of albumin excretion [43] and that screening for albuminuria identifies people at high risk for CV events. In the 1998 WHO definition of the metabolic syndrome, microalbuminuria was included as one of four criteria together with dyslipidemia, central obesity and hypertension in subjects with insulin resistance, impaired glucose tolerance, or type 2 diabetes. In vivo and in vitro data support the notion that dyslipidemia contributes to glomerular and interstitial injury of the renal parenchyma. In turn, progressive renal disease may lead, at early stages, to compositional changes in lipoproteins that result in an atherogenic profile [54].
The small sample size of our study does not allow meaningful statistical stratification related to the presence/absence of risk markers such as hypertension, microalbuminuria or baseline triglyceride levels. Precaution regarding the results of our study with a limited number of participants should be exercised. Larger-scale, prospective long-term studies in type 2 diabetic subjects are needed to clarify whether a deranged postprandial lipid profile plays an important role for the susceptibility of CAD in type 2 diabetes.
In conclusion, excessive postprandial responses of total triglycerides and retinyl palmitate-labeled lipoproteins in the CM-rich fraction were observed in type 2 diabetic men with, rather than without, prior MI suggesting a reduced postprandial clearance and/or increased production. Given the atherogenicity of these changes, our results stress the importance of an aggressive therapeutical approach towards type 2 diabetic males with CAD. Larger-scale prospective longitudinal studies to evaluate markers of postprandial lipid metabolism related to hard endpoints in type 2 diabetic subjects are needed. The presence of excessive postprandial lipemia in type 2 diabetic subjects may be a marker of a high-risk population prone to experience atherosclerotic events.
Acknowledgments:
Supported by grants from "Trælastbranchens Fond af 1975", "Konsul Johannes Fogh-Nielsens og Fru Ella Fogh-Nielsens Legat", Aarhus Amtssygehus Research Foundation, the Danish Research Council, Danish Diabetes Association, the Danish Heart Foundation, Institute of Experimental Clinical Research, Aarhus University, The Novo Nordisk Foundation, and The Novo Nordisk Research Foundation Committee.
References
- Stamler J, Vaccaro O, Neaton JD, Wentworth D. Diabetes, other risk factors, and 12-yr cardiovascular mortality for men screened in the Multiple Risk Factor Intervention Trial. Diabetes Care 1993. 16:434-444. [DOD]
- Kannel WB, McGee DL. Diabetes and cardiovascular disease. The Framingham study. JAMA 1979. 241:2035-2038. [DOD] [CrossRef]
- Stratton IM, Adler AI, Neil HA, Matthews DR, Manley SE, Cull CA, Hadden D, Turner RC, Holman RR. Association of glycaemia with macrovascular and microvascular complications of type 2 diabetes (UKPDS 35): prospective observational study. BMJ 2000. 321:405-412. [DOD] [CrossRef]
- Claudi T, Midthjell K, Holmen J, Fougner K, Kruger O, Wiseth R. Cardiovascular disease and risk factors in persons with type 2 diabetes diagnosed in a large population screening: the Nord-Trondelag Diabetes Study, Norway. J Intern Med 2000. 248:492-500. [DOD] [CrossRef]
- Haffner SM, Lehto S, Ronnemaa T, Pyorala K, Laakso M. Mortality from coronary heart disease in subjects with type 2 diabetes and in nondiabetic subjects with and without prior myocardial infarction. N Engl J Med 1998. 339:229-234. [DOD] [CrossRef]
- Gustafsson I, Hildebrandt P, Seibaek M, Melchior T, Torp-Pedersen C, Kober L, Kaiser-Nielsen P. Long-term prognosis of diabetic patients with myocardial infarction: relation to antidiabetic treatment regimen. The TRACE Study Group. Eur Heart J 2000. 21:1937-1943. [DOD] [CrossRef]
- Evans JM, Wang J, Morris AD. Comparison of cardiovascular risk between patients with type 2 diabetes and those who had had a myocardial infarction: cross sectional and cohort studies. BMJ 2002. 324:939-942. [DOD] [CrossRef]
- Grundy SM. Hypertriglyceridemia, atherogenic dyslipidemia, and the metabolic syndrome. Am J Cardiol 1998. 81:18B-25B. [DOD]
- Zilversmit DB. Atherogenesis: A Postprandial Phenomenon. Circulation 1979. 60:473-485. [DOD]
- Groot PH, van Stiphout WA, Krauss XH, Jansen H, van Tol A, van Ramshorst E, Chin-On S, Hofman A, Cresswell SR, Havekes L. Postprandial lipoprotein metabolism in normolipidemic men with and without coronary artery disease. Arterioscler Thromb 1991. 11:653-662. [DOD]
- Patsch JR, Miesenbock G, Hopferwieser T, Muhlberger V, Knapp E, Dunn JK, Gotto AM Jr, Patsch W. Relation of triglyceride metabolism and coronary artery disease. Studies in the postprandial state. Arterioscler Thromb 1992. 12:1336-1345. [DOD]
- Simons LA, Dwyer T, Simons J, Bernstein L, Mock P, Poonia NS, Balasubramaniam S, Baron D, Branson J, Morgan J, Roy P. Chylomicrons and chylomicron remnants in coronary artery disease: a case-control study. Atherosclerosis 1987. 65:181-189. [DOD] [CrossRef]
- Simpson HS, Williamson CM, Olivecrona T, Pringle S, Maclean J, Lorimer AR, Bonnefous F, Bogaievsky Y, Packard CJ, Shepherd J. Postprandial lipemia, fenofibrate and coronary artery disease. Atherosclerosis 1990. 85:193-202. [DOD] [CrossRef]
- Weintraub MS, Grosskopf I, Rassin T, Miller H, Charach G, Rotmensch HH, Liron M, Rubinstein A, Iaina A. Clearance of chylomicron remnants in normolipidaemic patients with coronary artery disease: case control study over three years. BMJ 1996. 312:936-939. [DOD]
- Syvanne M, Hilden H, Taskinen MR. Abnormal metabolism of postprandial lipoproteins in patients with non-insulin-dependent diabetes mellitus is not related to coronary artery disease. J Lipid Res 1994. 35:15-26. [DOD]
- Mero N, Malmstrom R, Steiner G, Taskinen MR, Syvanne M. Postprandial metabolism of apolipoprotein B-48- and B-100-containing particles in type 2 diabetes mellitus: relations to angiographically verified severity of coronary artery disease. Atherosclerosis 2000. 150:167-177. [DOD] [CrossRef]
- WHO Study Group. Diabetes Mellitus. Report of a WHO Study Group, 727. World Health Organization Technical Report Series 1985. [DOD]
- Teichholz LE, Kreulen T, Herman MV, Gorlin R. Problems in echocardiographic volume determinations: echocardiographic-angiographic correlations in the presence of absence of asynergy. Am J Cardiol 1976. 37:7-11. [DOD] [CrossRef]
- Heger JJ, Weyman AE, Wann LS, Dillon JC, Feigenbaum H. Cross-sectional echocardiography in acute myocardial infarction: detection and localization of regional left ventricular asynergy. Circulation 1979. 60:531-538. [DOD]
- Berning J, Rokkedal NJ, Launbjerg J, Fogh J, Mickley H, Andersen PE. Rapid estimation of left ventricular ejection fraction in acute myocardial infarction by echocardiographic wall motion analysis. Cardiology 1992. 80:257-266. [DOD]
- Saunamaki K, Egstrup K, Mickley H, Nielsen JR, Schnohr P, Thomassen AR. Vejledende retningslinier for arbejdstest i relation til iskæmisk hjertesygdom. Dansk Cardiologisk Selskab 1995. 1-28. [DOD]
- Pellett PL. Food energy requirements in humans. Am J Clin Nutr 1990. 51:711-722. [DOD]
- Chen YD, Reaven GM. Intestinally-derived lipoproteins: metabolism and clinical significance. Diabetes Metab Rev 1991. 7:191-208. [DOD]
- Blomhoff R, Green MH, Green JB, Berg T, Norum KR. Vitamin A metabolism: new perspectives on absorption, transport, and storage. Physiol Rev 1991. 71:951-990. [DOD]
- Thomsen C, Rasmussen O, Lousen T, Holst JJ, Fenselau S, Schrezenmeir J, Hermansen K. Differential effects of saturated and monounsaturated fatty acids on postprandial lipemia and incretin responses in healthy subjects. Am J Clin Nutr 1999. 69:1135-1143. [DOD]
- O'Brien E, Mee F, Atkins N, O'Malley K. Accuracy of the SpaceLabs 90207 determined by the British Hypertension Society Protocol. J Hypertens 1991. 9(6):573-574. [DOD]
- Copeland KC, Kenney FA, Nair KS. Heated dorsal hand vein sampling for metabolic studies: a reappraisal. Am J Physiol 1992. 263:E1010-E1014. [DOD]
- DeFronzo RA, Tobin JD, Andres R. Glucose clamp technique: a method for quantifying insulin secretion and resistance. Am J Physiol 1979. 237:E214-E223. [DOD]
- Hixson JE, Vernier DT. Restriction isotyping of human apolipoprotein E by gene amplification and cleavage with HhaI. J Lipid Res 1990. 31:545-548. [DOD]
- Jeppsson JO, Jerntorp P, Sundkvist G, Englund H, Nylund V. Measurement of hemoglobin A1c by a new liquid-chromatographic assay: methodology, clinical utility, and relation to glucose tolerance evaluated. Clin Chem 1986. 32:1867-1872. [DOD]
- Biesalski HK. Separation of retinyl esters and their geometric isomers by isocratic adsorption high-performance liquid chromatography. Methods Enzymol 1990. 189:181-189. [DOD]
- Schrezenmeir J, Weber P, Probst R, Biesalski HK, Luley C, Prellwitz W, Krause U, Beyer J. Postprandial pattern of triglyceride-rich lipoprotein in normal-weight humans after an oral lipid load: exaggerated triglycerides and altered insulin response in some subjects. Ann Nutr Metab 1992. 36:186-196. [DOD]
- Andersen L, Dinesen B, Jorgensen PN, Poulsen F, Roder ME. Enzyme immunoassay for intact human insulin in serum or plasma. Clin Chem 1993. 39:578-582. [DOD]
- Kieffer TJ, Habener JF. The glucagon-like peptides. Endocr Rev 1999. 20:876-913. [DOD] [CrossRef]
- Krarup T, Madsbad S, Moody AJ, Regeur L, Faber OK, Holst JJ, Sestoft L. Diminished immunoreactive gastric inhibitory polypeptide response to a meal in newly diagnosed type I (insulin-dependent) diabetics. J Clin Endocrinol Metab 1983. 56:1306-1312. [DOD]
- Hvidberg A, Nielsen MT, Hilsted J, Orskov C, Holst JJ. Effect of glucagon-like peptide-1 (proglucagon 78-107amide) on hepatic glucose production in healthy man. Metabolism 1994. 43:104-108. [DOD] [CrossRef]
- Orskov C, Jeppesen J, Madsbad S, Holst JJ. Proglucagon products in plasma of noninsulin-dependent diabetics and nondiabetic controls in the fasting state and after oral glucose and intravenous arginine. J Clin Invest 1991. 87:415-423. [DOD]
- Carstensen M, Thomsen C, Hermansen K. Incremental area under response curve more accurately describes the triglyceride response to an oral fat load in both healthy and type 2 diabetic subjects. Metabolism 2003. 52:1034-1037. [DOD] [CrossRef]
- Matthews JN, Altman DG, Campbell MJ, Royston P. Analysis of serial measurements in medical research. BMJ 1990. 300:230-235. [DOD]
- Lewis GF, O'Meara NM, Soltys PA, Blackman JD, Iverius PH, Pugh WL, Getz GS, Polonsky KS. Fasting hypertriglyceridemia in noninsulin-dependent diabetes mellitus is an important predictor of postprandial lipid and lipoprotein abnormalities. J Clin Endocrinol Metab 1991. 72:934-944. [DOD]
- Curtin A, Deegan P, Owens D, Collins P, Johnson A, Tomkin GH. Alterations in apolipoprotein B-48 in the postprandial state in NIDDM. Diabetologia 1994. 37:1259-1264. [DOD] [CrossRef]
- Gianturco SH, Ramprasad MP, Song R, Li R, Brown ML, Bradley WA. Apolipoprotein B-48 or its apolipoprotein B-100 equivalent mediates the binding of triglyceride-rich lipoproteins to their unique human monocyte-macrophage receptor. Arterioscler Thromb Vasc Biol 1998. 18:968-976. [DOD]
- Gerstein HC, Mann JF, Yi Q, Zinman B, Dinneen SF, Hoogwerf B, Halle JP, Young J, Rashkow A, Joyce C, et al. Albuminuria and risk of cardiovascular events, death, and heart failure in diabetic and nondiabetic individuals. JAMA 2001. 286:421-426. [DOD] [CrossRef]
- Assmann G, Schulte H. Diabetes mellitus and hypertension in the elderly: concomitant hyperlipidemia and coronary heart disease risk. Am J Cardiol 1989. 63:33H-37H. [DOD] [CrossRef]
- Schaefer EJ. Lipoproteins, nutrition, and heart disease. Am J Clin Nutr 2002. 75:191-212. [DOD]
- Thomsen C, Storm H, Christiansen C, Rasmussen OW, Larsen MK, Hermansen K. The day-to-day variation in insulin sensitivity in non-insulin-dependent diabetes mellitus patients assessed by the hyperinsulinemic-euglycemic clamp method. Metabolism 1997. 46:374-376. [DOD] [CrossRef]
- Patsch JR. Postprandial lipaemia. Baillieres Clin Endocrinol Metab 1987. 1:551-580. [DOD] [CrossRef]
- Mantel-Teeuwisse AK, Kloosterman JM, Maitland-van der Zee AH, Klungel OH, Porsius AJ, de Boer A. Drug-Induced lipid changes: a review of the unintended effects of some commonly used drugs on serum lipid levels. Drug Saf 2001. 24:443-456. [DOD] [CrossRef]
- Gall MA, Rossing P, Skott P, Hommel E, Mathiesen ER, Gerdes LU, Lauritzen M, Volund A, Faergeman O, Beck-Nielsen H. Placebo-controlled comparison of captopril, metoprolol, and hydrochlorothiazide therapy in non-insulin-dependent diabetic patients with primary hypertension. Am J Hypertens 1992. 5:257-265. [DOD]
- Boquist S, Ruotolo G, Hellenius ML, Danell-Toverud K, Karpe F, Hamsten A. Effects of a cardioselective beta-blocker on postprandial triglyceride-rich lipoproteins, low density lipoprotein particle size and glucose-insulin homeostasis in middle-aged men with modestly increased cardiovascular risk. Atherosclerosis 1998. 137:391-400. [DOD] [CrossRef]
- Sharrett AR, Heiss G, Chambless LE, Boerwinkle E, Coady SA, Folsom AR, Patsch W. Metabolic and lifestyle determinants of postprandial lipemia differ from those of fasting triglycerides: The Atherosclerosis Risk In Communities (ARIC) study. Arterioscler Thromb Vasc Biol 2001. 21:275-281. [DOD]
- Kuusisto J, Mykkanen L, Pyorala K, Laakso M. NIDDM and its metabolic control predict coronary heart disease in elderly subjects. Diabetes 1994. 43:960-967. [DOD]
- Thomsen C, Storm H, Holst JJ, Hermansen K. Differential effects of saturated and monounsaturated fats on postprandial lipemia and glucagon-like peptide 1 responses in patients with type 2 diabetes. Am J Clin Nutr 2003. 77:605-611. [DOD]
- Battisti W, Palmisano J, Keane W. Dyslipidemia in patients with Type 2 diabetes. Relationships between lipids, kidney disease and cardiovascular disease. Clin Chem Lab Med 2003. 41:1174-1181. [DOD] [CrossRef]
This article has been cited by other articles:

|
Nonfasting lipids, lipoproteins, and apolipoproteins in individuals with and without diabetes: 58 434 Individuals from the Copenhagen General Population Study
Langsted A, Nordestgaard BG
Clin Chem 2011. 57(3):482-489
|
|

|
Apolipoprotein B48 increment after test meal A increases small dense low-density lipoprotein cholesterol independently of triglyceride
Mori Y, Yamamoto T, Tokuno A, Hirano T
J Japan Diabetes Soc 2010. 53(8):593-600
|
|

|
Postprandial lipoproteins and cardiovascular disease risk in diabetes mellitus
Enkhmaa B, Ozturk Z, Anuurad E, Berglund L
Curr Diab Rep 2010. 10(1):61-69
|
|

|
Measures of postprandial lipoproteins are not associated with the presence of coronary artery disease in patients with type 2 diabetes mellitus
Reyes-Sofer G, Holleran S, Karmally W, Ngai C, Chen NT, Torres M, Ramakrishan R, Blaner WS, Berglund L, Ginsberg HN, Tuck C
J Lipid Res 2009. 50(9):1901-1909
|
|

|
Postprandial lipemia in diabetic men during hypolipemic therapy
Skoczynska A, Kreczynska B, Poreba R
Pol Arch Med Wewn 2009. 119(7-8):461-467
|
|

|
Combining insulins with oral antidiabetic agents: Effect on hyperglycemic control, markers of cardiovascular risk and disease
Hermansen K, Mortensen LS, Hermansen ML
Vasc Health Risk Manag 2008. 4(3):561-574
|
|

|
Effect of prior exercise on postprandial triglycerides in overweight young women after ingesting a high-carbohydrate meal
Mitchell JB, Rowe JR, Shah M, Barbee JJ, Watkins AM, Stephens C, Simmons S
Int J Sport Nutr Exerc Metab 2008. 18(1):49-65
|
|

|
Postprandial Triglyceride Response in Men: Role of Overweight, Abdominal Fat and Nutrition
Hitze B, Rubin D, Helwig U, Schrezenmeir J, Bosy-Westphal A, Müller MJ
Obes Facts 2008. 1(1):45-51
|
|

|
Incremental area under response curve more accurately describes the triglyceride response to an oral fat load in both healthy and type 2 diabetic subjects
Carstensen M, Thomsen C, Hermansen K
Metabolism 2003. 52(8):1034-1037
|
|
|


)
)
)
)