Review
| Rev Diabet Stud,
2006,
3(2):61-71 |
DOI 10.1900/RDS.2006.3.61 |
Can the Glycemic Index (GI) be Used as a Tool in the Prevention and Management of Type 2 Diabetes?
Marie-Louise F. Hermansen, Nina M.B. Eriksen, Lene S. Mortensen, Lotte Holm, Kjeld Hermansen
Department of Endocrinology and Metabolism, Aarhus University Hospital, Aarhus Sygehus THG, Tage-Hansens Gade 2, DK-8000 Aarhus C, Denmark.
Address correspondence to: Kjeld Hermansen, e-mail: kjeld.hermansen@as.aaa.dk
Keywords: type 2 diabetes, glycemic index, glycemic load, carbohydrate, nutrition, dietary prevention, dietary management, glycemic control
Abstract
The large increase in type 2 diabetes (T2DM), the considerable lifetime risk of diabetes and the loss of lifetime call for concerted action to prevent T2DM and its complications. Since diabetes is characterized by abnormal glucose metabolism, the question arises of whether a high intake of carbohydrates that are rapidly absorbed as glucose may increase the risk and worsen the course of T2DM. To quantify the impact of carbohydrates on blood glucose the glycemic index (GI) and the glycemic load (GL) have been applied. The GI of a food is a method of ranking carbohydrate rich foods according to their glycemic responses. GI is defined as the incremental area under the blood glucose curve of 50g carbohydrate of a test food expressed as a percentage of the area of the response to an equivalent amount of a reference food (glucose or white bread). In relation to GI/GL and prevention of T2DM there is insufficient information from observational studies to determine whether a positive association exists or not. Only randomized controlled clinical intervention studies will be able to provide the final answer. From meta-analyses of randomised controlled clinical trials comparing low and high GI diets in the treatment of diabetes it has been found that low GI diets improve the glycemic control. Labeling of foods with GI would be helpful for persons with diabetes, but the usefulness for healthy subjects remains to be clarified. At present it seems premature to introduce GI labeling for the entire population.
Introduction
Both genetic and environmental factors contribute to the development of type 2 diabetes (T2DM). The two major pathogenetic factors involved in glucose metabolism and ultimately leading to overt diabetes are insulin resistance and abnormal beta cell function.
T2DM accounting for about 90% of diabetes mellitus worldwide has become an epidemic during recent years. It is estimated to have affected more than 150 million people worldwide in 2000 and furthermore it is estimated that this number will increase to about 300 million by 2025 [1, 2]. The largest increase in T2DM is taking place in the developing countries of Asia, South America and Africa [3]. For Caucasians born in 2000 in the United States, the estimated lifetime risk of getting diabetes is 33% for men and 39% for women [4]. The risk among minority pop-ulations, e.g. Hispanic Americans is, however even higher [4]. In Denmark a population based survey from 2000 in 30 to 60-year-old people living in Copenhagen has shown a prevalence of diabetes varying between 0.7 and 15.8% increasing with in-creased body mass index (BMI), inactivity and age [5].
T2DM is associated with increased mortality especially attributable to cardiovascular disease such as ischemic heart disease (IHD) [6]. Age-adjusted mortality is 1.5-2.5 times higher than in the general population [6]. The excess mortality leads to large reductions in life expectancy. Based on the National Health interview Survey (1984-2000) it is estimated that if an individual born in 2000 is diagnosed diabetic at age 40 years, men will loose 11.6 life-years and women 14.3 life-years in average [4].
T2DM is one of the biggest challenges facing public health in the 21st century. The large increase in T2DM diabetes, the lifetime risk of diabetes and life-years lost call for concerted action to prevent T2DM and its complications. Beyond the consequences for the health and well-being of individuals, epidemic diabetes imposes a considerable economic burden on societies.
Among risk factors for T2DM, factors of inherent or developmental origin are not modifiable by diet and/or lifestyle changes, these include genetic factors, race/ethnicity, a positive family history, age and gen-der. However, a number of modifiable risk factors play a pivotal role in the development of T2DM. Overweight and obesity are the main drivers of T2DM. The relative risk of developing T2DM is increased 39-fold for people with a BMI of between 30-35, as compared to a BMI of 23 [7]. Profound changes in the quality, quantity and source of food consumed combined with sedentary lifestyles also play important roles for the increasing incidence of T2DM. A number of long-term intervention studies have demonstrated that weight loss, diet and/or exercise can lead to a pronounced reduction in the incidence of diabetes [8-10].
Since diabetes is characterized by abnormal glucose metabolism, the question arises if a high intake of carbohydrates that are rapidly absorbed as glucose may increase the risk and worsen the course of T2DM. To quantify the impact of carbohydrates on blood glucose the glycemic index (GI) and the glycemic load (GL) have been applied.
The present report focuses on the possible risk of developing T2DM for subjects on high GI or high GL diets. Furthermore, we look at the relevance and utility of the GI concept in short- to medium-term intervention studies in T2DM regarding the glycemic control. Finally, the application of GI in dietary recommendations and dietary counselling in T2DM is briefly discussed.
The concept of glycemic index (GI) and glycemic load (GL)
Jenkins et al. [11] introduced the glycemic index (GI) concept in 1981. It is a classification of the blood glucose-raising potential of carbohydrate foods. It is defined as the incremental area under the blood glucose curve (IAUC) of 50g carbohydrate of a test food expressed as a percentage of the response to 50g carbohydrate of a reference food [11] i.e. (IAUCtest/ IAUCreference) x 100 where IAUC equals the sum of the positive areas above basal whereas negative areas are not included. The concept of the GI can be applied not only to foods but also to whole meals or diets. However, various groups have used different duration times (1.5-3.0 h) for IAUC as well as different reference foods (glucose or white bread) and blood sampling techniques (venous or capillary blood). This inconsistency makes a direct comparison of results from different research groups difficult. The definition and methodology given by FAO/WHO in an expert report can, however, be used as an international standard [12] to reduce interlaboratory variations [13]. FAO/WHO recommend that to deter-mine the GI of a food, tests should be repeated in 6 or more subjects [12], which probably is much too low a number considering the large variation within and between people [13]. 50g carbohydrate portions of test foods should be compared with 50g carbohydrate portion of a standard food which can be either glucose or white bread [12]. If glucose is the standard, (i.e. GI of glucose = 100), the GI of various foods are lower than if white bread is the standard by a factor of 1.38, because the glycemic response of glucose is 1.38 times that of white bread [12]. The observation period that should apply is not clearly defined, however, in the illustration of calculation of incremental area under the blood glucose curve in healthy subjects, a 120 min period was applied [12].
A number of human and food related factors contribute to the variations in values given for the same foods in international tables [14, 15]. In persons both intra as well as inter individual variations con-tribute to differences in GI values. For type 2 diabetic subjects the day-to-day variation of blood glucose varies between 15-25% [16, 17]. Also many food factors are important determinants for the GI [18-22]. The proportion of fat, protein and carbohydrate may influence the glycemic responses of foods or meals. Fat reduces the blood glucose responses by slowing the gastric emptying, and large amounts of protein, e.g. milk protein, stimulates the insulin secretion and consequently can reduce the blood glucose responses [23]. Also particle sizes as well as the amount of starch play an important role in the size of the glycemic response and GI. The higher proportion of amylose vs. amylopectin in starch, the lower blood glucose response occurs [24]. The processing and storage of foods have an essential influence on their GI [20, 22]. Ripening of fruits e.g. bananas decreases the amount of resistant starch and increases the blood glucose response [25]. Also the eating time, composition and GI of a previous meal [26] as well as the size and meal frequency [27] influences the glycemic response to the same meal or food. Since the glucose responses depend both on the quantity and the quality of carbohydrates, the concept of glycemic load (GL) was introduced in 1997 [28, 29].
GL is calculated as the amount of carbohydrate multiplied by its GI, to represent both quantity and quality of the carbohydrate intake. For calculating the total dietary GL, the GL scores from all foods are added. A diet with a low GL thus can be achieved in several ways e.g. by replacing carbohydrate with protein or fat or substituting a high GI source of carbohydrate with a low GI or a combination.
The question arises whether a high GI diet and/or a high GL diet can lead to the development of T2DM?
Glycemic index (GI), glycemic load (GL) and the risk of type 2 diabetes
A number of studies have tested the hypothesis that high dietary GI and/or GL increase the risk of T2DM using data from a number of observational studies in healthy subjects (Table 1) [28-33]. No data from intervention studies are available. Such studies would have been more valuable, however, many subjects would be required in such a study which would be very expensive and difficult to carry out. Consequently, it is uncertain whether such studies will ever appear.
Table
1.
Glycemic index (GI), glycemic load (GL) and the risk of type 2 diabetes |
|
 |
 |
Legend:
W: women. M: men. GI: glucose index. GL: glucose load. RR: related risk. OR: odds ratio. CI: confidence interval. ns: not significant. * after multivariate adjustment. # after further adjustment for body mass index and waist-to-hip ratio. |
|
In 1997 Harvard researchers published the two first observational studies on the association between GI, GL and the relative risk of developing T2DM in healthy women [28] and men [29]. The Nurses' Health Study began in 1976, when 121,700 female nurses aged 30-55 years responded to a questionnaire regarding medical, lifestyle, and other health-related information [34]. In 1980 the diet was assessed using a 61-item, semi-quantitative food-frequency questionnaire [35]. An expanded dietary questionnaire of about 120 items [36] was used to update the information about diet in 1986. Using a follow-up period from 1986 to 1992, 915 cases of T2DM occurred in the population of 65,173 women who completed the questionnaire as seen in Table 1.
After adjustment for age, body mass index, alcohol intake, physical activity, cereal fiber intake and other potential confounders, women in the highest quintile of GI and GL had a 37% and 47% higher risk of diabetes, respectively, than the lowest quintile [28]. The combination of a low intake of cereal fiber and high GL was associated with a 2.5-fold higher risk of diabetes [28]. More recently, the 16 year follow-up of the Nurses' Health Study from 1980 including 3300 incident cases of T2DM confirmed the association between high GL and the risk of developing T2DM [37].
In the Health Professional's Follow-up Study consisting of 42,759 men without diabetes [29], the Harvard group observed a similar relation between high GI and risk of developing diabetes with a relative increased risk of 1.37 as seen in Table 1. Although high GL was not associated with a significantly increased risk of T2DM, it is noteworthy that the combination of high GL and low cereal fiber increased the risk of T2DM more than 2-fold when compared with a diet with low GL and a high cereal fiber intake [29].
A younger group of 91,249 women established in 1989 (The Nurses Health Study II) was followed for 8 years with 741 cases of T2DM being identified [30]. After adjustment for age, body mass index, family history of diabetes, and other potential confounders, GI was found to be associated with an increased risk of T2DM [30]. Comparing the highest with the lowest GI quintile, a 59% increased relative risk of T2DM was detected. In contrast, GL was not significantly associated with a higher risk of T2DM [30].
In a group of 31,641 adults followed for 4 years, Hodge et al. [31] found after multivariate adjustment a positive association between GI and T2DM with a 1.32 increased relative risk comparing the highest and the lowest quartiles. However, the association of GI with T2DM was weakened after an adjustment for body mass index and waist hip ratio (p = 0.08).
On the other hand, two other group studies [32, 33] did not find any association between GI and GL and diabetes incidence. In the Iowa Women's Health Study, Meyer et al. [32] followed 35,998 older women who completed the same dietary questionnaire used in the Nurses' Health Study [28] while Stevens et al. [33] in the Atherosclerosis Risk in Communities (ARIC) Study followed 12,251 women and men (Caucasians as well as African-Americans) using a modified version of the 61-item instrument of Willet and co-workers [34]. Two major problems with these observational studies exist: diabetes is self-reported and only to some extent has been confirmed by laboratory testing and secondly the GI of many foods is unknown. In some studies a follow-up of the diagnosis with a supplementary questionnaire was introduced. For example, in the Nurses' Health Study [28] and the Health Professional's Follow-up Study [29] the diagnosis of type 2 diabetes was established subsequently when criteria corresponded to criteria proposed by the National Diabetes Data Group [38]. The validity of self-reported diabetes in this group using the supplementary questionnaire has been previously documented. In the Melbourne Collaborative Cohort Study [31] where no association between GI and T2DM was seen at follow-up, type 2 diabetes was confirmed in 76% of self-reported cases. In the Iowa Women's Health Study [32], only 66% in a small sub-study of self-reported cases were confirmed. Furthermore, in observational studies symptomless diabetes is largely not taken into account probably representing a considerable number of subjects. Another concern is the validity of the GI data for different carbohydrate sources. Because many food products have unknown GI values, extrapolation may be a significant source of error.
The concept of high GL in relation to the risk of T2DM does not seem to play an important role. While some prospective observational studies [28-30] have shown a significant association between high GI diets and the risk of developing T2DM, other studies [32, 33] do not. Most positive studies originate from one group, the Harvard group, applying certain food frequency questionnaires for GI and GL.
To be convinced that the association between high GI and risk of T2DM does exist, it is necessary to confirm these results with other research groups using adequate dietary assessment methods. Only randomized controlled clinical studies, however, can prove that high GI diets increase the risk of T2DM.
Thus, at present there is insufficient information to determine whether there is a relationship between GI or GL of diet and the development of diabetes.
GI, GL and the treatment of type 2 diabetes
The hallmark feature of diabetes is hyperglycemia and we know that this not only causes acute symptoms but is also associated with long-term microvascular complications such as retinopathy, nephropathy and neuropathy [39, 40]. In addition, hyperglycemia may contribute to the development of macrovascular disease with IHD [41]. Thus, regulation of glycated hemoglobin (HbA1c) that provides a weighted average of glycemia over approximately the preceding 3 months [42], to achieve near-normal value is a primary goal in the management of diabetes. In this context it seems plausible to hypothesize, that GI and GL of the regular diet are positively associated with HbA1c. The concept that GI of the regular diet should be directly associated with HbA1c arises from the rationale for the use of acarbose to treat T2DM. Acarbose, an α-glucosidase inhibitor, inhibits amylase and sucrase enzyme activity and thus slows carbohydrate digestion. In a dose-dependent fashion, acarbose decreases post-prandial hyperglycemia and insulin excursions [43] and reduces HbA1c substantially in T2DM subjects [44]. Similarly, regular diets that are lower in GI would be expected to be more slowly digested and absorbed [11] and yield long-term metabolic benefits with curbed glucose increases and lower HbA1c values. Recently, also the 'physiological validity' for the GL concept of meals was supported, i.e. variations in GL of test meals were associated with plasma glucose values measured 2h after ingestion of test meals [45].
Effects of low vs. high GI diets on metabolic control
The question arises if the GI concept can be applied in the treatment of T2DM; both in whether it improves the glycemic control and whether it will be possible to maintain these lifestyle changes in the longer term and translate the GI concept to larger groups of diabetic subjects. The GI concept has been challenged for not being applicable to mixed meals, and hence the long-term effects of low GI foods have been questioned [46].
Järvi and co-workers [47] have evaluated the effects of two carbohydrate rich diets with pronounced differences in GI (56.8 ± 3.6 U vs. 82.7 ± 3.1 U with white bread as a reference) on metabolic control in T2DM patients. In a 4 wk randomized crossover study consisting of 20 subjects, they kept the macronutrient composition and the type and amount of dietary fibers identical. The GI was calculated on the basis of data for 94% of all the carbohydrate foods, the difference in GI was achieved by altering the structure of the starchy foods, and the diets were composed in accordance with dietary recommendation for people with diabetes.
In the low GI period a statistically significant lower HbA1c was obtained than during the high GI period (6.7% vs. 6.9%). The insulin sensitivity measured by the clamp techniques was improved significantly after both diets, significantly more however after the low versus the high GI diet (30% vs. 21%, p < 0.05) while the fasting plasma glucose fell by 14% during both the low and high GI period. Some of the improvement in insulin sensitivity after both diets is likely to have been caused by the slight, but identical weight loss observed. The incremental area under the curve (IAUC) for both plasma glucose and plasma insulin was lower after the low GI than after the high GI diet (lowered by 31% and 27%, respectively). The study also demonstrated an improved lipid profile with a significantly higher reduction in LDL cholesterol after the low GI diet. In addition, they found an improved capacity for fibrinolysis after the low GI diet reflected in a reduced PAI-1 level [47]. All together these results indicate a beneficial therapeutic potential for low GI diets in T2DM.
The beneficial effect of a low-GI diet compared to a high GI diet on the glycemic control and insulin sensitivity was also demonstrated by Rizkalla et al. in a randomized controlled cross-over study in 12 T2DM men [48]. During the low GI period carbohydrate items with a GI below 45 were recommended while foods with a GI higher than 60 were recommended during the high GI period using glucose as the GI reference. After four weeks on a low GI diet with an average GI of 39, significant improvements were observed in fasting plasma glucose and HbA1c, incremental AUC for plasma insulin (lowered by 23%) and whole body insulin sensitivity estimated by the euglycemic clamp technique compared to the high GI period [48]. Rizkalla and co-workers [48] claim that their low GI diet is the diet with the lowest GI applied. However, taking the different reference food into account the GI is similar to the low GI diet of Järvi et al. [47]. Thus to convert the GI of 39 from using glucose as the reference to a number with white bread as the reference, the value of 39 should be multiplied with 1.4 [12, 49], i.e. reaching 55 vs. 57 in the study of Järvi et al. [47]. Also lower LDL cholesterol and PAI-1 levels were observed during the low GI diet period corroborating the results of Järvi et al. [47]. Some of the improvements during the low GI period in the study of Rizkalla and co-workers [48] may be ascribed to the higher average fiber content in the low GI diet (34 vs. 21 g/day). The results of these two studies [47, 48], however, strongly indicate that long-term use of low GI diets may have a great potential in the treatment of T2DM. However, not all studies have found significant improvement in overall blood glucose in response to low GI diets [18].
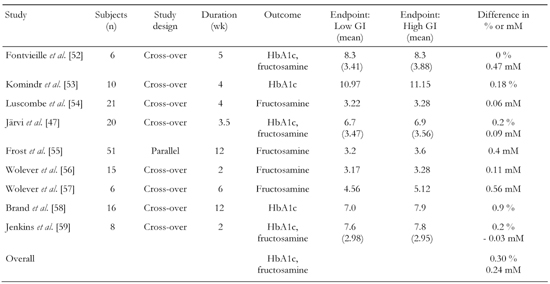
Brand-Miller et al. [50] have carried out a retrospective meta-analysis of randomised controlled clinical trials comparing low and high GI diets in the treatment of T1DM and T2DM. The aim was to determine if low GI diets, when compared with conventional or high GI diets, improved overall glycemic control in individuals with diabetes, as assessed by reduced HbA1c or fructosamine levels. HbA1c or fructosamine levels were used instead of fasting blood glucose levels because both reflect overall glycemic control. They are both non-enzymatic glycated proteins reflecting blood glucose. Fructosamine reflects a 3 wk interval, and was used as endpoint in studies of ≤ 6 wk of duration. HbA1c was used in studies > 6 wk. HbA1c is determined by both the postprandial plasma glucose (PPG) and the fasting plasma glucose (FPG) [51]. With decreasing HbA1c values the relative contribution of postprandial glucose increases progressively whereas the relative contribution of fasting glucose decreases gradually [51]. In the meta-analysis of Brand-Miller et al. 14 studies were identified that met the inclusion criteria [50]. They were all: 1. published in English between 1981-2001, 2. randomized cross-over or parallel experimental design, 3. at least 12 days duration (from 12 days - 12 months), 4. type 1 or type 2 diabetic patients as subjects, 5. HbA1c or fructosamine level as outcome measures of glycemic control, 6. modification of at least two meals per day (or > 50 % total carbohydrate). Out of the 14 studies that fulfilled the inclusion criteria, 9 of the studies comprised of 153 subjects with T2DM (Table 2).
Table
2.
Results from the retrospective meta-analysis of randomised controlled clinical trials comparing low and high GI diets in the treatment of type 2 diabetes (T2DM) by Brand-Miller et al. [50] |
|
 |
|
Legend:
GI: glucose index. GL: glucose load. HbA1c: glycated hemoglobin. |
|
As seen in Table 2, studies in T2DM demonstrated that low GI diets reduced HbA1c by 0.30% points and fructosamine by 0.24 mM over and above that of high GI diets. Brand-Miller et al. found that low GI diets globally reduced HbA1c by 0.43% points compared to high GI diets in studies with both T1DM and T2DM subjects [50]. Because the units of measurements differ between the two indexes of glycemic control, the primary outcome can also be expressed as a percentage of the final value on the high GI diet: (low GI vs. high GI) × 100/high GI [50].
The mean difference (both T1DM and T2DM patients) was -6.8% in favor of the low GI-diet. When adjusted for differences at baseline the difference was -7.4%. A 7.4% decrease in glycated protein is equivalent to a HbA1c reduction of approximately 0.6%. In the 9 studies that included subjects with T2DM - one of which included both T1DM and T2DM [52] - the mean difference was -6.1% in favor of low GI diets.
Assessment of study differences
The limitations of the meta-analysis include the small number of subjects and the short duration. Besides there is the question of dietary compliance since all the patients were living unrestrictedly such that the validity of dietary records is debatable. Importantly, results of negative trials may not be published and may lead to a publication bias. However, the risk of such a publication bias may less likely be attributed to the controversy of the GI concept.
Despite the limitations, the findings suggest that the application of a low GI diet in the management of diabetes has improved clinical effects compared with the current practise of nutrition therapy. Any difference in glycemic control between 2 diets may be confounded by differences in energy intake or weight loss. In most studies included in the meta-analysis [50] the energy intake, macro nutrient composition and weight were kept constant. The improvement of blood glucose reflected in glycated proteins, has been criticized [61] for being small, compared with outcomes of other nutrition interventions that have been found to be able to cause a 15-20% decrease in HbA1c. It should be stressed, that the 6.1% reduction in T2DM resulting from the meta-analysis [50] is the incremental effect of a low GI diet, over and above that seen with another intensive nutritional intervention (high GI diets) and not with a basic care that would tend to cause a larger difference. The results of Brand-Miller et al. [50] are supported by the more recent meta-analysis by Opperman et al. [62], which also looked at the effects of GI on markers for lipid metabolism. The investigators also found that a low GI diet improved the glycemic control in T2DM. In T1DM and T2DM a reduction in HbA1c of 0.27% was observed in favor of low GI diets with a difference in GI units between low and high GI diets of 21 units [62].
Not surprisingly studies that lasted longer than 4 wk showed greater improvements in HbA1c than shorter studies [62]. Brand-Miller et al. [50] found a slightly larger reduction in HbA1c than Opperman et al. [62] did probably due to access to a larger number of studies. Not all studies have been able to detect an effect of GI on glycemic control, e.g. in the study of Tsihlias et al. [63] comparing the effect on HbA1c in subjects with T2DM that received about 10 percent of energy from low-GI breakfast cereal (n = 30) with high-GI cereal (n = 29). After 6 months no statistical significant difference in HbA1c on the two diets could be detected. The reason for a lacking impact on HbA1c may well be ascribed to the minimal difference in GI of about 10 units between the two diets [63]. Thus, despite negative results [63] and limitations of the studies conducted, there is evidence suggesting that we can obtain a clinically useful effect of low GI diets on glycemic control in T2DM. Interestingly, low GI diets also seem to cause improvements in LDL-cholesterol and total cholesterol in T2DM, while no changes were found in triglyceride or HDL-cholesterol [62]. When incorporating these benefits of a low GI diet with other dietary interventions such as high fiber, low saturated fat and low trans-fat the influence of a low GI diet may possibly be magnified. However, more long-term randomized clinically controlled studies are required to determine whether the GI approach decreases the risk of development of T2DM and its complications, including IHD.
GI and guidelines in the treatment of diabetes
Across the Atlantic there is agreement that near-normal levels of blood glucose is a primary goal in the treatment of diabetes. When it comes to general guidelines and application of the GI, the American and European experts are in disagreement. There is at this time, no international consensus as to the clinical usefulness of the GI in the dietary prevention and management of diabetes.
American guidelines
The American Diabetes Association (ADA) has historically been hesitant towards the GI approach. In their recommendations of 2002, it is stressed, that the total amount of carbohydrate in meals is more important than the source or type [64]. Their latest statement from 2004 is slightly more positive towards the GI. As part of their recommendations they state that:
"Regulation of blood glucose to achieve near-normal levels is a primary goal in the management of diabetes, and, thus, dietary techniques that limit hyperglycemia following a meal are likely important in limiting the complications of diabetes" [65]. And the ADA states regarding influence on blood glucose: "Both the amount (grams) of carbohydrate as well as the type of carbohydrate in a food influence blood glucose level. The total amount of carbohydrate consumed is a strong predictor of glycemic response, and, thus, monitoring total grams of carbohydrate whether by use of exchanges or carbohydrate counting, remains a key strategy in achieving glycemic control" [65].
The meta-analysis by Brand-Miller et al. discussed above is also taken into account [50]. The ADA adds: "A recent meta-anlysis of the randomized controlled trials that have examined the efficacy of the glycemic index in the overall blood glucose control indicates that the use of this technique can provide an additional benefit over that observed when total carbohydrate is considered alone" [65].
European guidelines
The European guidelines are more supportive of the GI concept. In 2004 the Diabetes and Nutrition Study Group (DNSG) of the European Association for the Study of Diabetes (EASD) published their latest recommendations [66]. Here it is emphasized, that "vegetables, fruits and wholegrain cereals should be incorporated into the diet of people with T1DM and T2DM" [66]. Besides it is stated, that "if carbohydrate intake is at the upper end of the recommended range it is particularly important to emphasise foods rich in dietary fiber and with a low GI" [66]. The European guidelines concerning the GI are clear, as DSNG recommends carbohydrate-rich, low glycemic index foods as suitable carbohydrate-rich choices as long as other attributes of the foods are appropriate [66].
The DNSG concludes, that the "GI concept is only meaningful when comparing foods within a comparable food group e.g. breads, fruits, different types of pasta or rice. GI values should not be used in isolation, but interpreted in relation to other relevant food characteristics e.g. energy content, content of other macronutrients, available carbohydrates and dietary fiber" [66].
Both ADA and DNSG agree that there is no justification for the recommendation of very low-carbohydrate diets in the management of diabetes.
Implementation and practical issues
The meta-analysis discussed [50, 62] supports the use of the GI concept as a scientifically based tool in selecting carbohydrate rich foods. When it comes to the practical application of the GI concept in the management of diabetes, there are, however, several issues to consider.
Dieticians and medical experts have the detailed knowledge necessary to use the GI. By use of international tables of GI [49] which represent more than 1200 different types of foods, dieticians can guide diabetics towards carbohydrate rich, low GI foods. Some tables also list the glycemic load associated with the consumption of specific serving sizes of different foods [67]. One weakness of the existing international tables is that they have not been verified to be valid for different nationalities and ethnic minorities. GI values for foods should be determined using an internationally standardised GI methodology and the accuracy of this methodology should be verified in inter-laboratory tests. The GI concept should not be used in isolation. GI values in tables should be combined with contents of fiber, macronutrients including available carbohydrates enabling the calculation of GL. Comparison of GI should be restricted to foods within the same food groups.
It is not likely that many individual diabetic subjects at present can use the GI tables in everyday life. A more simple approach, which can be applied without medical expertise, should be developed. One way of achieving this is by labeling carbohydrate-rich food items with a GI label as well as an informative label. The food items could be divided into e.g. three groups with low GI (< 70), medium GI (range 70-110) and high GI foods (> 110) when applying white bread as the reference. Most milled cereal products, including bread and breakfast cereals, have a high GI, whereas legumes, pasta, many fruits, whole grain bread have a low GI. To make the three groups easy to inspect, each group could be labelled with a colour e.g. a green GI label on low GI value foods, a yellow on medium GI value foods and a red label on high GI value foods. In order to prevent misinterpretation of the GI values, the GI label should only appear on food products that meet certain nutrient criteria. Some foods may be rich in saturated fat and free sugars and have a low GI [66], however, such foods should not be labelled. GI is especially appropriate to use for carbohydrate rich foods such as pasta, rice, potatoes, bread and breakfast cereals. For the system to make sense for the population as such, the GI must be proven useful in healthy individuals.
GI labeling could make the choice easier for subjects with diabetes to eat traditional foods with low GI such as pasta, parboiled rice, whole grain breads, vegetables and fruits. In Australia and New Zealand the GI index is used in nutrition guidance, and GI rating of packaged food products in supermarkets is performed [67].
Conclusion
In recent years the manifestation of T2DM has become an epidemic. The fact that T2DM is shortening lifetimes, and that it has become a heavy economic burden on societies worldwide, has made it essential to find ways to prevent and manage T2DM and its complications. International dietary guidelines recommend a diet rich in fruits, vegetables, pulses and whole-grain cereals, but vary regarding the importance of GI. Some observational studies suggest that low GI diets may contribute to the prevention of T2DM, but a consensus has not yet been reached. No evidence sug-gests that a high intake of mono- or disaccharides is causative in the development of T2DM [68]. In the most recent report of a joint WHO/FAO expert consultation the strength of evidence that low GI foods reduce the risk of diabetes is therefore only graded as "possible" [69]. Thus, in relation to GI/GL and prevention of T2DM there is insufficient infor-mation to determine whether a positive association exists or not. Only randomized controlled clinical intervention studies will be able to provide the final answer.
From retrospective meta-analyses of randomised controlled clinical trials comparing low and high GI diets in the treatment of diabetes [50, 62] it has been found that low GI diets as compared with high GI diets improve the glycemic control assessed by HbA1c and fructosamine.
In conclusion, the findings suggest that targeting postprandial hyperglycamia via choice of low GI foods has a clinically useful effect on glycemic control in T2DM. Though there is still need for long term randomized clinically controlled intervention trials to determine whether low GI diets decrease the risk of development of T2DM and its complications. Labeling of foods with GI would be helpful for persons with diabetes, but the usefulness for healthy subjects remains to be clarified. Therefore, it seems to be pre-mature to introduce GI labeling for the entire population.
References
- King H, Aubert RE, Herman WH. Global burden of diabetes, 1995-2025: prevalence, numerical estimates, and projections. Diabetes Care 1998. 21:1414-1431. [DOD]
- Wild S, Roglic G, Green A, Sicree R, King H. Global prevalence of diabetes: estimates for the year 2000 and projections for 2030. Diabetes Care 2004. 27:1047-1053. [DOD]
- Stumvoll M, Goldstein BJ, van Haeften TW. Type 2 diabetes: principles of pathogenesis and therapy. Lancet 2005. 365:1333-1346. [DOD] [CrossRef]
- Narayan KM, Boyle JP, Thompson TJ, Sorensen SW, Williamson DF. Lifetime risk for diabetes mellitus in the United States. JAMA 2003. 290:1884-1890. [DOD] [CrossRef]
- Glumer C, Jorgensen T, Borch-Johnsen K. Prevalence of diabetes and impaired glucose regulation in a Danish population: the Inter99 study. Diabetes Care 2003. 26:2335-2340. [DOD]
- Roper NA, Bilous RW, Kelly WF, Unwin NC, Connolly VM. Excess mortality in a population with diabetes and the impact of material deprivation: longitudinal, population based study. BMJ 2001. 322:1389-1393. [DOD] [CrossRef]
- Colditz GA, Willett WC, Stampfer MJ, Manson JE, Hennekens CH, Arky RA, Speizer FE. Weight as a risk factor for clinical diabetes in women. Am J Epidemiol 1990. 132:501-513. [DOD]
- Pan XR, Li GW, Hu YH, Wang JX, Yang WY, An ZX, Hu ZX, Lin J, Xiao JZ, Cao HB, et al. Effects of diet and exercise in preventing NIDDM in people with impaired glucose tolerance. The Da Qing IGT and Diabetes Study. Diabetes Care 1997. 20:537-544. [DOD]
- Tuomilehto J, Lindstrom J, Eriksson JG, Valle TT, Hamalainen H, Ilanne-Parikka P, Keinanen-Kiukaanniemi S, Laakso M, Louheranta A, Rastas M, Salminen V, Uusitupa M. Prevention of type 2 diabetes mellitus by changes in lifestyle among subjects with impaired glucose tolerance. Finnish Diabetes Prevention Study Group. N Engl J Med 2001. 344:1343-1350. [DOD] [CrossRef]
- Knowler WC, Barrett-Connor E, Fowler SE, Hamman RF, Lachin JM, Walker EA, Nathan DM. Reduction in the incidence of type 2 diabetes with lifestyle intervention or metformin. Diabetes Prevention program Research Group. N Engl J Med 2002. 346:393-403. [DOD] [CrossRef]
- Jenkins DJ, Wolever TM, Taylor RH, Barker H, Fielden H, Baldwin JM, Bowling AC, Newman HC, Jenkins AL, Goff DV. Glycemic index of foods: a physiological basis for carbohydrate exchange. Am J Clin Nutr 1981. 34:362-366. [DOD]
- Food and Agriculture Organization. Carbohydrates in human nutrition: report of a joint FAO/WHO expert consultation. FAO Food Nutr Pap 1998. 66:1-140. [DOD]
- Wolever TM, Vorster HH, Bjorck I, Brand-Miller J, Brighenti F, Mann JI, Ramdath DD, Granfeldt Y, Holt S, Perry TL, Venter C, Xiaomei Wu. Determination of the glycaemic index of foods: interlaboratory study. Eur J Clin Nutr 2003. 57:475-482. [DOD] [CrossRef]
- Foster-Powell K, Holt SH, Brand-Miller JC. International table of glycemic index and glycemic load values 2002. Am J Clin Nutr 2002. 76:5-56. [DOD]
- Henry CJ, Lightowler HJ, Strik CM, Renton H, Hails S. Glycaemic index and glycaemic load values of commercially available products in the UK. Br J Nutr 2005. 94:922-930. [DOD] [CrossRef]
- Rasmussen O, Gregersen S, Dorup J, Hermansen K. Day-to-day variation of blood glucose and insulin responses in NIDDM subjects after starch-rich meal. Diabetes Care 1992. 4:522-524. [DOD]
- Wolever TM, Nuttall FQ, Lee R, Wong GS, Josse RG, Csima A, Jenkins DJ. Prediction of the relative blood glucose response of mixed meals using the white bread glycemic index. Diabetes Care 1985. 8:418-428. [DOD]
- Hermansen K. Research methodologies in the evaluation of intestinal glucose absorption and the concept of glycemic index. In: Mogensen CE, Standl E, Gruyter, et al (ed). Research Methodologies in Human Diabetes, Berlin-New York, 1994. Part 1, pp 205-218. [DOD]
- Wolever TM, Bolognesi C. Source and amount of carbohydrate affect postprandial glucose and insulin in normal subject. J Nutr 1996. 126:2798-2806. [DOD]
- Brand JC, Nicholson PL, Thorburn AW, Truswell AS. Food processing and the glycemic index. Am J Clin Nutr 1985. 42:1192-1196. [DOD]
- Rasmussen OW. Nutrition and diabetes mellitus: Influence of carbohydrate and monosaturated fat on the intermediary metabolism. Thesis. University of Aarhus 1997. pp 1-74. [DOD]
- Bjorck I, Liljeberg H, Ostman E. Low glycaemic-index foods. Br J Nutr 2000. 83:149-155. [DOD]
- Frid AH, Nilsson M, Holst JJ, Bjorck IM. Effect of whey on blood glucose and insulin responses to composite breakfast and lunch meals in type 2 diabetic subjects. Am J Clin Nutr 2005. 82:69-75. [DOD]
- Larsen HN, Christensen C, Rasmussen OW, Tetens IH, Choudhury NH, Thilsted SH, Hermansen K. Influence of parboiling and physico-chemical characteristics of rice on the glycaemic index in non-insulin-dependent diabetic subjects. Eur J Clin Nutr 1996. 50:22-27. [DOD]
- Hermansen K, Rasmussen O, Gregersen S, Larsen S. Influence of ripeness of banana on the blood glucose and insulin response in type 2 diabetic subjects. Diabetic Medicine 1992. 9:739-743. [DOD]
- Wolever TM, Jenkins DJ, Ocana AM, Rao VA, Collier GR. Second-meal effect: low-glycemic-index foods eaten at dinner improve subsequent breakfast glycemic response. Am J Clin Nutr 1988. 48:1041-1047. [DOD]
- Bertelsen J, Christiansen C, Thomsen C, Poulsen PL, Vestergaard S, Steinov A, Rasmussen LH, Rasmussen O, Hermansen K. Effect of meal frequency on blood glucose, insulin, and free fatty acids in NIDDM subjects. Diabetes Care 1993. 16:4-7. [DOD]
- Salmeron J, Manson JE, Stampfer MJ, Colditz GA, Wing AL, Willett WC. Dietary fiber, glycemic load, and risk of non-insulin-dependent diabetes mellitus in women. JAMA 1997. 277:472-477. [DOD] [CrossRef]
- Salmeron J, Ascheiro A, Rimm EB, Colditz GA, Spiegelman D, Jenkins DJ, Stampfer MJ, Wing AL, Willet WC. Dietary fiber, glycemic load, and risk of NIDDM in men. Diabetes Care 1997. 20:545-550. [DOD]
- Schulze MB, Liu S, Rimm EB, Manson JE, Willett WC, Hu FB. Glycemic index, glycemic load, and dietary fiber intake and incidence of type 2 diabetes in younger and middle-aged women. Am J Clin Nutr 2004. 80:348-356. [DOD]
- Hodge AM, English DR, O'Dea K, Giles GG. Glycemic index and dietary fiber and the risk of type 2 diabetes. Diabetes Care 2004. 27:2701-2706. [DOD]
- Meyer KA, Kushi LH, Jacobs DR Jr, Slavin J, Sellers TA, Folsom AR. Carbohydrates, dietary fiber, and incident type 2 diabetes in older women. Am J Clin Nutr 2000. 71:921-930. [DOD]
- Stevens J, Ahn K, Juhaeri, Houston D, Steffan L, Couper D. Dietary fiber intake and glycemic index and incidence of diabetes in African-American and white adults: the Aric study. Diabetes Care 2002. 25:1715-1721. [DOD]
- Colditz GA, Manson JE, Hankinson SE. The Nurses' Health Study: 20-year contribution to the understanding of health among women. J Womens Health 1997. 6:49-62. [DOD]
- Willett WC, Sampson L, Stampfer MJ, Rosner B, Bain C, Witschi J, Hennekens CH, Speizer FE. Reproducibility and validity of a semiquantitative food frequency questionnaire. Am J Epidemiol 1985. 122:51-65. [DOD]
- Willett WC. Nutritional Epidemiology. 2nd ed. Oxford University Press, New York, 1998. [DOD]
- Hu FB, Manson JE, Stampfer MJ, Colditz G, Liu S, Solomon CG, Willett WC. Diet, lifestyle, and the risk of type 2 diabetes mellitus in women. N Engl J Med 2001. 345:790-797. [DOD] [CrossRef]
- National Diabetes Data Group. Classification and diagnosis of diabetes mellitus and other categories of glucose intolerance. Diabetes 1979. 28:1039-1057. [DOD]
- The Diabetes Control and Complications Trial Research Group. The effect of intensive treatment of diabetes on the development and progression of long-term complications in insulin-dependent diabetes mellitus. N Eng J Med 1993. 329:977-986. [DOD] [CrossRef]
- UK Prospective Diabetes Study (UKPDS) Group. Intensive blood-glucose control with sulfonylureas or insulin compared with conventional treatment and risk of complications in patients with type-2 diabetes (UKPDS 33). Lancet 1998. 352:837-853. [DOD] [CrossRef]
- Turner RC, Millns H, Neil HA, Stratton IM, Manley SE, Matthews DR, Holman RR. Risk factors for coronary artery disease in non-insulin dependent diabetes mellitus: United Kingdom Prospective Diabetes Study (UKPDS: 23). BMJ 1998. 316:823-828. [DOD]
- Tahara Y, Shima K. Kinetics of HbA1c, glycated albumin, and fructosamine and analysis of their weight functions against preceding plasma glucose level 1. Diabetes Care 1995. 18:440-447. [DOD]
- Bischoff H. The mechanism of alpha-glycosidase inhibition in the management of diabetes. Clin Invest Med 1995. 18:303-311. [DOD]
- Coniff RF, Shapiro JA, Robbins D, Kleinfield R, Seaton TB, Beisswenger P, McGill JB. Reduction of glycosylated hemoglobin and postprandial hyperglycemia by acarbose in patients with NIDDM. A placebo-controlled dose-comparison study. Diabetes Care 1995. 18:817-824. [DOD]
- Brand-Miller JC, Thomas M, Swan V, Ahmad ZI, Petocz P, Colagiuri S. Physiological validation of the concept of glycemic load in lean young adults. J Nutr 2003. 133:2728-2732. [DOD]
- Hollenbeck CB, Coulston AM. The clinical utility of the glycemic index and its application to mixed meals. Can J Physiol Pharmacol 1991. 69:100-107. [DOD]
- Jarvi AE, Karlstrom BE, Granfeldt YE, Bjorck IE, Asp NG, Vessby BO. Improved glycemic control and lipid profile and normalized fibrinolytic activity on a low GI diet in type 2 diabetic patients. Diabetic Care 1999. 22:16-18. [DOD]
- Rizkalla SW, Taghrid L, Laromiguiere M, Huet D, Boillot J, Rigoir A, Elgrably F, Slama G. Improved plasma glucose control, whole-body glucose utilization and lipid profile on a low-glycemic index diet in type 2 diabetec men. Diabetes Care 2004. 27:1866-1872. [DOD]
- Foster-Powell K, Holt SH, Brand-Miller JC. International table of glycemic index and glycemic load values. Am J Clin Nutr 2002. 76:5-56. [DOD]
- Brand-Miller J, Hayne S, Petocz P, Colagiuri S. Low-glycemic index diets in the management of diabetes. A meta-analysis of randomized controlled trials. Diabetes Care 2003. 26:2261-2267. [DOD]
- Monnier L, Lapinski H, Colette C. Contributions of fasting and postprandial blood glucose increments to the overall diurnal hyperglycemia of type 2 diabetic patients. Diabetes Care 2003. 26:881-885. [DOD]
- Fontville A, Rizkalla S, Penfornis A, Acosta M, Bornet F, Slama G. The use of low glycemic index foods improves metabolic control of diabetic patients over five weeks. Diabet Med 1992. 9:444-450. [DOD]
- Komindr S, Ingsriswang S, Lerdvuthisopon N, Boontawee A. Effect of long-term intake of Asien food with different glycemic indices on diabetic control and protein conservation in type 2 diabetic patients. J Med Assoc Thai 2001. 84:85-97. [DOD]
- Luscombe N, Noakes M, Clifton P. Diets high and low in glycemic index versus high monounsaturated fat diets: effects on glucose and lipid metabolism in NIDDM. Eur J Clin Nutr 1999. 53: 473-478. [DOD] [CrossRef]
- Frost G, Wilding J, Beecham J. Dietary advice based on the glycaemic index improves dietary profile and metabolic control in type 2 diabetic patients. Diabet Med 1994. 11:397-401. [DOD]
- Wolever T, Jenkins D, Vuksan V, Jenkins A, Buckley G, Wong G, Josse RG. Beneficial effect of a low glycemic index diet in type 2 diabetes. Diab Med 1992. 9:451-458. [DOD]
- Wolever T, Jenkins D, Vuksan V, Jenkins A, Wong G, Josse R. Beneficial effect of low-glycemic index diet in overweight NIDDM subjects. Diabetes Care 1992. 15:562-564. [DOD]
- Brand J, Colagiuri S, Crossman S, Allen A, Robert D, Truswell A. Low-glycemic index foods improve long-term glycemic control in NIDDM. Diabetes Care 1991. 14:95-101. [DOD]
- Jenkins DJ, Wolever TM, Buckley G, Lam KY, Giudici S, Kalmusky J, Jenkins AL, Patten RL, Bird J, Wong GS, et al. Low glycemic-index starchy foods in the diabetic diet. Am J Clin Nutr 1988. 48:248-254. [DOD]
- Mann J. Meta-analysis of low-glycemic index diets in the management of diabetes. Response to Franz. Diabetes Care 2003. 26:3364. [DOD]
- Franz MJ. The Glycemic Index. Not the most effective nutrition therapy intervention. Diabetes Care 2004. 26:2466-2468. [DOD]
- Opperman AM, Venter CS, Oosthuizen W, Thompson RL, Vorster HH. Meta-analysis of the health effects of using the glycemic index in meal-planning. Br J Nutr 2004. 92:367-381. [DOD] [CrossRef]
- Tsihlias EB, Gibbs AL, McBurney MI, Wolever TM. Comparison of high- and low-glycemic-index breakfast cereals with monounsaturated fat in the long-term dietary management of type 2 diabetes. Am J Clin Nutr 2000. 72:439-449. [DOD]
- American Diabetes Association. Evidence-based nutrition principles and recommendations for the treatment and prevention of diabetes and related complications, position statement. Diabetes Care 2002. 25:202-212. [DOD]
- American Diabetes Association. Dietary Carbohydrate (amount and type) in the prevention and management of diabetes. Diabetes Care 2004. 27:2266-2271. [DOD]
- Diabetes and Nutrition Study Group (DNSG) of the European Association for the Study of Diabetes. Evidence-based nutritional approaches to the treatment and prevention of diabetes mellitus. Nutr Metab Cardiovasc Dis 2004. 14:373-394. [DOD] [CrossRef]
- http://www. healthyeatingclub.com/info/articles/diseases/GIsymbol.htm. [DOD]
- Raben A, Hermansen K. Health aspects of mono- and disaccharides in Carbohydrates in food. In: Eliasson AC (ed). CRC Press, Taylor and Francis Group, Boca Raton, London, New York, Second edition 2006. pp 89-127. [DOD]
- Joint WHO/FAO Expert Consultation. Diet, Nutrition and the Prevention of Chronic Diseases. World Health Organ Tech Rep Ser 2003. 916:1-149. [DOD]
This article has been cited by other articles:
|


)
)