Original Data
| Rev Diabet Stud,
2007,
4(3):159-168 |
DOI 10.1900/RDS.2007.4.159 |
Diabetic Cardiomyopathy in OVE26 Mice Shows Mitochondrial ROS Production and Divergence Between In Vivo and In Vitro Contractility
Ye Song1, Yibo Du1, Sumanth D. Prabhu2, Paul N. Epstein1
1Department of Pediatrics, University of Louisville and Louisville VAMC, Louisville, Kentucky, USA
2Department of Medicine/Cardiology, University of Louisville and Louisville VAMC, Louisville, Kentucky, USA
Address correspondence to: Paul N. Epstein, e-mail: paul.epstein@louisville.edu
Keywords: type 1 diabetes, cardiomyopathy, contractility, cardiomyocytes, echocardiography, mitochondria, reactive oxygen species
Abstract
Many diabetic patients suffer from a cardiomyopathy that cannot be explained solely by poor coronary perfusion. This cardiomyopathy may be due to either organ-based damage like fibrosis, or to direct damage to cardiomyocytes. Mitochondrial-derived reactive oxygen species (ROS) have been proposed to contribute to this cardiomyopathy. To address these questions, we used the OVE26 mouse model of severe type 1 diabetes to measure contractility in isolated cardiomyocytes by edge detection and in vivo with echocardiography. We also assessed the source of ROS generation using both a general and a mitochondrial specific indicator. When contractility was assayed in freshly isolated myocytes, contraction was much stronger in control myocytes. However, contractility of normal myocytes became weaker during 24 hours of in vitro culture. In contrast, contractility of diabetic OVE26 myocytes remains stable during culture. Echocardiography revealed normal or hyperdynamic function in OVE26 hearts under basal conditions but with a sharply reduced response to isoproterenol, a β-adrenergic agonist. For ROS generation, we found that ROS production in diabetic myocytes was elevated after exposure to either high glucose or angiotensin II (AngII). Superoxide detection with the mitochondrial sensor MitoSOX Red confirmed that mitochondria are a major source of ROS generation in diabetic myocytes. These results show that contractile deficits in OVE26 diabetic hearts are due primarily to cardiomyocyte impairment and that ROS from mitochondria are a cause of that impairment.
Introduction
Cardiac failure has become one of the leading causes of morbidity and mortality in type 1 and 2 diabetes. Accumulated evidence indicates that heart failure in diabetes is due at least in part to a specific cardiomyopathy, referred to as diabetic cardiomyopathy, which is distinct from other diabetes-associated risk factors such as hypertension or coronary artery disease [1, 2]. Diabetic cardiomyopathy was first proposed by Rubler et al. [3] in 1972 based on postmortem findings of heart failure in diabetic patients free of coronary artery disease and it has been confirmed by others in subsequent clinical studies [4] and experimental models such as in streptozotocin-induced insulinopenic diabetes [5] as well as in genetically predisposed insulin-resistant models [6]. Although its mechanism remains poorly understood, the characteristics of clinical diabetic cardiomyopathy include prolongation of relaxation and impaired contractility [7].
Reactive oxygen species (ROS) are continuously produced in most cells under physiological conditions, and their levels are regulated by a number of antioxidant enzymes such as superoxide dismutase, glutathione peroxidase and catalase as well as by other nonenzymatic antioxidants. When the production of ROS becomes excessive, harmful oxidative stress develops. There is abundant experimental and clinical evidence that the generation of ROS is increased in diabetes and that diabetic complications, including diabetic cardiomyopathy, are associated with oxidative stress [8, 9]. Mitochondria are known to generate superoxide radical continuously as a byproduct of electron transport. The significance of mitochondria-generated ROS in diabetes has been proposed by several laboratories [10, 11]. Brownlee's laboratory proposed that ROS from mitochondria activate multiple pathological pathways that induce diabetic complications [11, 12]. Much of the original evidence for the role of mitochondria in diabetes-induced damage derives from studies of endothelial cells. The role of mitochondrial oxidative stress is less certain in diabetic cardiomyopathy. Since myocytes are the major cell type in the heart, and they are responsible for cardiac contractility, we use adult mouse cardiomyoctyes cultured under stable conditions to understand diabetic cardiac contractile malfunction and ROS generation.
OVE26 mice are a model of type 1 diabetes [12, 13]. The advantages of this model for the study of complications are straightforward. Diabetes is severe, consistent and has an early onset. OVE26 diabetic mice can live well over a year without treatment, direct damage is specific to the pancreatic β-cell and breeding is simple. OVE26 mice show cardiac abnormalities which include reduced cardiomyocyte contractility [14], degenerating mitochondrial morphology [15] and reduced mitochondrial glutathione content [16]. Furthermore, we produced transgenic mice with increased activity of the mitochondrial antioxidant enzyme MnSOD, targeted to the heart. When crossed onto the OVE26 background their cardiomyocytes exhibit less contractile dysfunction and a significant improvement in mitochondrial respiration [15].
In the current study, we cultured mature cardiomyocytes in an improved culture system that allows myocytes to retain viability and almost normal structure for several days. A mitochondrial specific ROS indicator was used to uncover the subcellular source of ROS. OVE26 cardiac contractility was measured by edge detection in individual myocytes and echocardiography in live animals. Our results show that mitochondria are a major source of ROS production in diabetic cardiomyocytes. They also show that contractility was markedly more impaired in isolated myocytes than in whole heart. Unexpectedly, contractility in cultured diabetic cardiomyocytes was more stable than in cultured normal myocytes.
Material and methods
Experimental animals
OVE26 diabetic mice have been previously described [17]. OVE26-positive mice were recognized by the presence of small eyes as a result of the co-integration of the GR19 gene, which is expressed in the eye. Age-matched OVE26 and FVB mice of both sexes were obtained at 20 weeks of age. All transgenic and non-transgenic animals were maintained on the inbred FVB background. Average body weights of male and female OVE26 mice were within 10% of age/sex-matched FVB controls. After fasting OVE26 mice for 12 hours, blood glucose levels remained elevated at between 300 and 550 mg/dl. Mice were maintained on a 12-h light/dark cycle and received food (Purina Laboratory Rodent Diet 5001) and water ad libitum. The U.S. Department of Agriculture certified Institutional Animal Care and Use Committee (IACUC) approved all animal procedures.
Culture of adult mouse cardiac myocytes
Cardiomyocytes from adult mouse hearts were isolated according to the Alliance for Cellular Signaling (AfCS) Procedure Protocol PP00000125 with modification. Briefly, after anesthesia with isofluorane, hearts were quickly removed and perfused through the aorta with perfusion buffer containing 135 mM NaCl, 4.0 mM KCl, 1.0 mM MgCl2, 0.33 mM NaH2PO4, 10mM HEPES, 0.1% 2,3-butanedione monoxime and 10 mM glucose, pH 6.95. Then the heart was perfused again with perfusion buffer supplemented with collagenase II (Worthington, NJ) for 11-20 min. The left ventricle was removed after perfusion and teased into small pieces with fine forceps in stopping buffer (perfusion buffer with 10% bovine calf serum and 12.5 μM calcium added to stop digestion). The cell suspension was transferred to a 15 ml conical tube. The heart tissues were further dissociated using plastic transfer pipettes with different sized openings. Myocytes were allowed to sediment by gravity for 8 to 10 min.
After removal of the supernatant, the pellet was carefully suspended in stopping buffer. Calcium was re-introduced into cells by the addition of 10, 20, 30, 40 and 100 μl of 30 mM calcium to reach a final calcium concentration of 1.25 mM. Isolated ventricular myocytes were plated at a density of 50 rod-shaped myocytes per square millimeter on laminin-coated cover slips in culture dishes containing plating medium (MEM, 10% bovine calf serum, 10 mM 2,3-butanedione monoxime, 100 Units/ml penicillin, 2 mM glutamine and 2 mM NaATP), in 2% CO2, 37°C.
After 1 hour's incubation, the culture medium was changed. Myocytes maintain their rod shape with fine striation for up to 4 days without any further manipulation. Usually about 1.2 million cardiomyocytes can be harvested from one mouse heart using this method: rod-shaped cell yield is around 80 to 90%. There was no notable difference in yield between normal FVB and transgenic mice.
Intracellular/mitochondrial ROS measurement by fluorescence probes
Intracellular oxidant stress was monitored by measuring changes in fluorescence resulting from intracellular probe oxidation. Cellular ROS generation was determined with the membrane-permeable probe 5-(6)-chloromethyl-2', 7'-dichlorodihydrofluorescein diacetate (CM-H2DCFDA), which enters cardiomyocytes and produces a fluorescent signal after intracellular oxidation by ROS such as peroxynitrite and hydroxyl radical [18]. MitoSOX Red, a mitochondrial superoxide indicator dye (Invitrogen), was used to determine ROS in the mitochondria.
One hour after plating, as described above, cells were loaded with 10μM CM-H2DCFDA (Molecular Probes, Eugene, OR) at 37°C for 30 min or 1 μM MitoSOX Red (Molecular probes, Eugene, OR) for 10 min, maximum fluorescence uptake interval was assessed by preliminary experiments. After one wash, cardiomyocytes from each group were incubated in culture medium with normal glucose (5.5 mmol/l), high glucose (25 mmol/l), normal glucose plus angiotensin II (50 nmol/l) or normal glucose plus hydrogen peroxide as a positive control (H2O2, 40 μmol/l).
After 1 hour's incubation, the myocytes were washed twice with warm culture medium. Fluorescence intensity was measured: changes in CM-H2DCFDA fluorescence were followed kinetically with a SPECTRA Fluor Plus plate reader (Tecan U.S. Inc., Durham, NC) at an excitation wavelength of 485 nm and an emission wavelength of 535 nm for 2 hours while maintaining temperature at 37°C. Fluorescence was normalized to cellular DNA content. MitoSOX Red fluorescence intensity was captured at 510/580 nm using an Olympus IX70 microscope equipped with a digital cooled charged-coupled device camera and Adobe Photoshop image software. InSpeck microspheres (Molecular Probes) were used to calibrate MitoSOX Red fluorescence by calculating the ratio of myocyte fluorescent intensities to the fluorescent beads. Phenol red-free medium was used throughout the experiments to avoid dye interference.
Cell shortening/relengthening
The mechanical properties of ventricular myocytes were assessed using a video-based edge-detection system (IonOptix, Milton, MA) [19]. Cells were measured on glass cover slips under medium or, if freshly isolated, on a glass cover slip dish (Harvard Apparatus, Holliston, MA) mounted on the stage of an inverted microscope (Olympus, IX-70). The cells were field-stimulated at a frequency of 1.0 Hz, 4-ms duration, using a pair of platinum wires placed on opposite sides of the dish chamber connected to the MyoPacer Field Stimulator (IonOptix). The polarity of the stimulatory electrodes was reversed frequently to avoid possible build-up of electrolyte by-products. The myocytes being studied were displayed on the computer monitor using an IonOptix MyoCam camera, which scans the image area every 8.3 ms such that the amplitude and velocity of shortening/relengthening was recorded with good fidelity. Soft-edge software (IonOptix) was used to capture changes in cell length during shortening and relengthening.
Echocardiographic evaluation
Echocardiographic assessment provides serial information on LV size, wall thickness, mass and systolic function. Animals were lightly sedated with tribromoethanol (0.25 mg/g, i.p.), a dose that produces only a modest reduction in left ventricular (LV) shortening fraction [20]. The chest was shaved and the mouse positioned in the left lateral decubitus position. Imaging was performed in the parasternal long-axis (LAX), short-axis (SAX) and apical views using a custom-made gel-filled acoustic standoff and a Toshiba Powervision echocardiography machine. A pediatric 7.5 MHz broad-band transducer effectively operating at 10 MHz frequency and 168 Hz frame rate was used to obtain two-dimensional, M-mode and spectral Doppler images. Images were recorded at baseline and 5 min after the administration of isoproterenol (300 ng/g, i.p.).
The following measurements were made during recording or off-line from stored data on video tape after frame-digitization: 1) LV anteroposterior diameter (D, mm), anterior and posterior wall thickness (AWT and PWT, mm, respectively) and SAX cross-sectional area (A, mm2) at end-diastole (ED) and end-systole (ES) [21, 22]. LV hypertrophy was additionally assessed by: 1) the relative wall thickness (RWT = EDAWT + EDPWT)/EDD and 2) LV mass (mg): [(EDD+EDAWT+EDPWT)3EDD3] × 1.055. LV systolic function was indexed by: 1) fractional shortening (FS): [EDD-ESD]/EDD, 2) fractional area change (FAC): [EDA-ESA]/EDA and 3) mean velocity of circumferential fiber shortening (Vcf, circ/s): FS/ET, where ET is ejection time as determined from the aortic Doppler trace, and 4) heart rate (HR) corrected Vcf (Vcfc): Vcf divided by the square root of the RR interval in seconds. In the absence of acute changes in afterload, Vcfc provides an index of LV contractility [23].
Data analysis
Data are expressed as means ± SE. Statistical comparisons were performed by ANOVA and Student-t tests among different groups. Significance was defined as p < 0.05.
Results
Cell shortening and relengthening in fresh and cultured myocytes from FVB and OVE26 mice
A direct assessment of cardiomyocyte function was made by measuring contractility using edge-detection technology in isolated myocytes (Figure 1). This approach eliminates non-myocyte factors that can influence contractility, such as fibrosis, coronary vascular occlusion and autonomic influence. Myocytes were isolated and cultured as described in Materials and Methods. Contractility was measured in freshly isolated myocytes and myocytes cultured for 1 and 24 h. Consistent with our previous results [15] and those of Duan et al. [24], the contractile function of FVB myocytes was significantly better than that of OVE26 myocytes when measured immediately after isolation. FVB contractility was also stronger at 1 h after culture but not after 24 h of culture. The reason for the gradual loss of difference between the two groups was that FVB contractility progressively declined with time after isolation but OVE26 myocytes exhibited stable contractility at all time points.
 |
 |
Figure 1. Contractile properties of isolated myocytes. Myocytes were assayed immediately after isolation (fresh) and after culture (1 h and 24 h) from five month old FVB mice (white columns) or OVE26 mice (black columns). L: lengthening (in μm). t: time (in seconds). A: maximal velocities of cell shortening (+dL/dt). B: re-lengthening (-dL/dt). C: cardiomyocyte shortening indicated as the peak contraction expressed as % of basal myocyte length (blpeak). Values are mean ± SE, from at least 4 mice per time point and 15 cells measured per mouse. Asterisk indicates that OVE26 cardiomyocytes have lower function than FVB myocytes at the same time point. Number sign indicates that FVB myocytes have stronger function at that time point than those at all longer time points. OVE26 myocyte contractility was not significantly affected by time after isolation. |
|
Echocardiographic parameters of function in OVE26 and FVB mice
Cardiac function in vivo was evaluated by echocardiography in eight anesthetized FVB control mice and nine OVE26 diabetic mice under basal and isoproterenol-stimulated conditions (Table 1). Measurements were made at 4 to 5 months of age. Surprisingly, several functional parameters were significantly augmented under basal conditions in OVE26 mice, including heart rate, Vcfc, EF and FS. However, the stimulatory response to isoproterenol injection was less in OVE26 mice than in FVB mice. As a result of the reduced isoproterenol response, all four parameters that were elevated under basal conditions in OVE26 mice were no longer elevated after isoproterenol treatment and one became significantly reduced (heart rate). The percent stimulation by isoproterenol for each parameter is also shown in Table 1. Five parameters showed significantly less response to isoproterenol in OVE26 hearts (p ≤ 0.02) indicating catecholamine desensitization and reduced contractile reserve. Failure to respond to catecholamine stimulation is typical of impaired cardiac performance and diabetic hearts [25].
Table
1.
Measurements of cardiac function at baseline and after isoproterenol stimulation in FVB and OVE26 mice by echocardiography |
|
 |
|
Legend:
Data are mean ± SE. HR: heart rate. Comparison between FVB and OVE26 mice was calculated using Student’s t-test. LVIDD and LVIDS: diastolic and systolic left ventricle diameter. LVAWD: diastolic anterior wall thickness. LVPWD: diastolic posterior wall thickness. LV mass: left ventricle mass. LV mass/BW: LV mass in mg/body weight in grams. EF: ejection fraction (EF = difference between end-diastolic and end-systolic volume in a ventricle divided by end-diastolic volume). FS: fractional shortening. ET: ejection time. ms: milliseconds. Vcf: mean velocity of circumferential shortening (Vcf, circ/s = FS/ejection time). Vcfc: HR-corrected Vcf, i.e. Vcf divided by the square root of the RR interval (in seconds). IP: isoproterenol. Baseline/IP stim. (%): % of baseline after isoproterenol stimulation. n.s.: not significant. |
|
Intracellular ROS levels in cultured myocytes from FVB and OVE26 mice
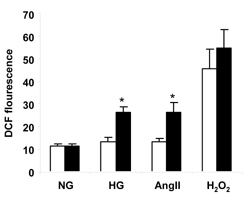
Figure 2 shows myocyte ROS production measured with the intracellular ROS indicator, CM-H2DCFDA, using a fluorescence plate reader. Cardiomyocytes were cultured for one hour and then exposed to normal glucose, high glucose, AngII, or H2O2 for one hour. Normal extracellular glucose produced similar ROS intensities in FVB and OVE26 cardiomyocytes. Exposure of myocytes to 40 μmol/l H2O2 markedly increased the fluorescent intensities from both groups but there was still no significant difference between FVB and OVE26 groups. However, high glucose (25 mmol/l) or AngII (50 nmol/l) treatment increased ROS production from OVE26 but not FVB myocytes. As a result, OVE26 fluorescence was nearly two-fold higher than FVB fluorescence (p < 0.05).
 |
|
Figure 2. Quantitation of ROS production from FVB (white columns) and OVE26 (black columns) myocytes measured with CM-H2DCFDA after exposure to normal glucose (NG, 5.5 mmol/l), high glucose (HG, 25 mmol/l), angiotensin II (AngII, 50 nmol/l) and H2O2 (40 μmol/l) for 1 h. DCF: dichlorodihydrofluorescein. Asterisk indicates that OVE26 fluorescence was greater than FVB under the same culture conditions and greater than OVE26 under normal glucose (p < 0.05, by 2-way ANOVA). Fluorescence after H2O2 was greater than all other conditions (p < 0.01) but OVE26 was no different from FVB. Cardiomyocytes were isolated from 180-220 day old mice of both sexes. Data are mean ± SE. n = 4 mice/group, assayed in triplicate. |
|
Mitochondrial ROS levels in cultured myocytes from FVB and OVE26 mice
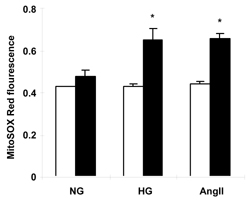
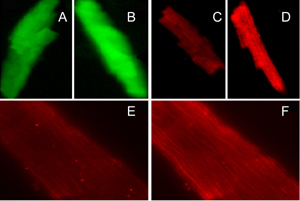
To determine whether mitochondria contributed to total cellular ROS generation, we utilized the mitochondrial ROS detection reagent MitoSOX Red in combination with fluorescence microscopy. As shown in Figure 3, high glucose and AngII treatments caused increased mitochondrial fluorescence in live cultured cardiomyocytes from OVE26 mice (p < 0.05) but not FVB myocytes. This is a very similar to the observation made with CM-H2DCFDA fluorescence (Figure 2) and indicates that OVE26 mitochondria contribute to overall elevated ROS production in OVE26 myocytes exposed to high glucose and AngII stimulation. Figure 4 illustrates the increase in ROS induced by high glucose or AngII in OVE26 cardiomyocyte using both fluorescent indicators. The stippled linear pattern of fluorescence in cardiomyocytes loaded with MitoSOX Red is consistent with mitochondrial localization.
 |
|
Figure 3. Mitochondrial ROS levels detected by MitoSOX Red after exposure of FVB (white columns) and OVE26 (black columns) cardiomyocytes to high glucose or AngII. Asterisk indicates p < 0.05 vs. all other values except OVE26 with Ang II or high glucose by 2-way ANOVA. NG: normal glucose (5.5 mmol/l). HG: high glucose (25 mmol/l). AngII: 5.5 mmol/l glucose + angiotensin II (50 nmol/l). Values are the mean ± SE of at least 120 myocytes from 3 mice of each type. |
|
 |
|
Figure 4. Representative images of cardiomyocytes after incubation with CM-H2DCFDA (A and B) and MitoSOX Red (C and D, 20×; E and F, 100×). Myocytes on the left (A, C and E) represent ROS baseline, myocytes on the right (B, D and F) represent ROS induced by high glucose or angiotensin II in OVE26 mice. |
|
Discussion
Freshly isolated OVE26 diabetic cardiomyocytes had reduced contractility compared to control FVB myocytes. This confirms previous myocyte data, using an improved myocyte isolation and culture method that allows several days of viability [26]. These results are also in agreement with data obtained in other models of diabetes [27, 28]. Over time, FVB myocyte contractility decreased while diabetic myocyte contractility was stable. Most of the decrease in FVB contractility occurred at about the time that myocytes attach to the laminin substrate. Many of the differences between OVE26 and FVB myocyte contractility disappeared after 24 hours of culture.
As far as we can determine, this is the first study to evaluate adult normal or diabetic mouse myocyte contractility over time in culture. Our results show that different types of myocytes are more sensitive to time in culture. It is not clear why diabetic contractility was stable under the same culture conditions that caused declining contractility of FVB control myocytes. The superior initial contractility of FVB myocytes may be due to their healthier in vivo environment, which disappears during culture. Since insulin is not present in our culture system and it is deficient in type 1 diabetes, we tested whether the addition of insulin to the culture medium would stabilize contractility in FVB myocytes. Our preliminary data (not shown) failed to show any stabilizing effect of insulin on FVB myocyte contractility at 3 hours of culture. Therefore, we expect that other factors will be needed to maintain stable normal myocyte contractility. Another possibility is that the diabetic environment enhances antioxidant enzyme expression or other stress defenses of OVE26 myocytes. This may contribute to their greater contractile stability. It is also possible that the contractility of the diabetic myocytes was affected by the media glucose concentration, which was maintained at 10 mM in these experiments. Diabetic myocytes may be better adapted to 10 mM glucose then normal myocytes, providing the OVE26 myocytes with an advantage over non-diabetic myocytes during culture. Alternatively, high glucose during culture will produce more oxidative stress in diabetic myocytes (as shown in Figures 2 and 3). However, this would be damaging to OVE26 myocytes. Experiments to test the effect of ambient glucose on OVE26 cardiomyocytes will determine whether glucose culture conditions influence cardiomyocyte contractility. It is clear that the time-dependent decline in normal myocyte contractility is a problem that needs to be considered in designing long-term culture studies of adult myocytes.
Unlike the impaired contractility of isolated OVE26 myocytes, echocardiography revealed no impairment in basal diabetic cardiac contractility. In fact, ejection fraction, fractional shortening and heart rate-corrected velocity of circumferential shortening were all significantly higher in OVE26 hearts than in normal hearts when measured under basal anesthetized conditions. Echocardiography results revealed no significant changes in absolute or relative wall thickness or LV mass. The diabetes literature is not fully consistent with respect to the effect of type 1 diabetes on the echocardiogram. Most studies using echocardiography in type 1 streptozotocin (STZ)-diabetic mouse models have shown significant left ventricular cardiac contractile dysfunction [29, 30], while other studies did not find impaired contractility [31, 32]. It is unclear why OVE26 hearts did not show basal cardiac dysfunction. Possible reasons include the background strain: OVE26 mice are the only diabetic mice that have been tested on the FVB background. In addition, all of the above mentioned models, except OVE26, used STZ to induce diabetes. STZ is directly toxic to cardiomyocytes [33], which is the likely cause of ventricular contractile dysfunction independent of diabetes. Another possible factor is that STZ-induced diabetes develops within a couple of days in adult mice, while diabetes in OVE26 mice is more gradual and occurs in neonates [34]. At this time it is not possible to determine which of these factors, strain, age or cause of diabetes, is the critical factor in determining whether diabetes produces abnormal contractility and echocardiography.
Despite the better than normal contractility of OVE26 hearts we found that they had a clearly blunted response to isoproterenol. This was significant for both heart rate and contractility. This result is consistent with the reduced responsiveness of diabetic hearts to beta adrenergic stimulation that has been established for several decades [35, 36]. The reduced isoproterenol response of OVE26 hearts may at least partially explain why basal diabetic cardiac contractility measured by echocardiography appeared unimpaired, while contractility of isolated OVE26 myocytes was significantly impaired. If OVE26 mice compensate for impaired cardiomyocyte contractility by increasing cardiac adrenergic stimulation, then OVE26 contractility could appear healthy despite impaired contractile capacity of individual myocytes. Adding more adrenergic stimulation in vivo by isoproterenol injection would then produce a weaker response in OVE26 hearts since they were already functioning under adrenergic stimulation. The results are consistent with heightened adrenergic tone in OVE26 diabetes that augments basal function in vivo, at least at this stage of the disease. As there could be no comparable augmentation of adrenergic tone in isolated myocytes, underlying contractile depression was uncovered in the cell preparation. Chronic increased cardiac adrenergic tone is also present in type 1 diabetic patients [37, 38] and this can account for the reduced adrenergic responsiveness of diabetic hearts. Elevated sympathetic tone might also contribute to the gradual development of diabetic cardiomyopathy.
Oxidative stress is a common feature of diabetic tissue and multiple cellular sources can produce ROS. In this study, ROS production in cultured myocytes was measured with the two ROS indicators, CM-H2DCFDA, which reacts with many free radicals and provides no indication of subcellular origin and MitoSOX Red, which reacts specifically with superoxide in mitochondria. Consistent with our previous results with CM-H2DCFDA [14, 26], high glucose or AngII treatment increased ROS production from OVE26 diabetic but not FVB control myocytes. A mitochondrial source of excess diabetic myocyte ROS generation has been suggested by several studies using mitochondrial electron transport chain (ETC) inhibitors [14, 39]. To confirm this source we utilized the superoxide detection reagent MitoSOX Red which targets mitochondria. High glucose or AngII treatment caused increased MitoSOX Red fluorescence in cultured cardiomyocytes from OVE26 mice but not FVB myocytes. This result provides independent confirmation that mitochondria are an important source of excess ROS production in diabetic cardiomyocytes. High glucose is likely to increase mitochondrial generation of ROS because of an increased rate of reduction of the mitochondrial ETC. This has been proposed by Brownlee [11] to be the primary cause of diabetic complications. It is also consistent with our finding of pronounced damage to diabetic mitochondria in OVE26 heart [16] and protection from this damage by the mitochondrial antioxidant enzyme MnSOD [15].
Our data show that AngII, like high glucose, increases mitochondrial ROS production in diabetic cardiomyocytes. Since AngII acts on cell surface receptors, not on mitochondria, this indicates that there is a pathway linking the cardiomyocyte AngII receptor to mitochondrial generation of ROS. Such a pathway has been proposed by Zhang et al. [40]. They suggest that cytoplasmic superoxide, derived from NADPH oxidase, induces opening of mitochondrial KATP channels and that this causes increased mitochondrial ROS production. NADPH oxidase is a likely mediator of this effect in the diabetic heart since it is present in the heart [41, 42], upregulated by diabetes [18, 43] and produces more ROS in the presence of hyperglycemia [43] or AngII [40]. Thus, an explanation for our AngII ROS results in diabetic cardiomyocytes is that superoxide from NADPH oxidase triggers increased mitochondrial ROS production.
Conclusions
In freshly isolated myocytes, contractility is much stronger in control myocytes than in diabetic myocytes. The contractility of normal myocytes becomes weaker during 24 hours of in vitro culture. In contrast, the contractility of diabetic OVE26 myocytes remains stable during culture. This may be because normal myocytes are going from an optimal in vivo environment to suboptimal culture conditions, whereas diabetic cardiomyocytes are going from suboptimal in vivo conditions to suboptimal culture conditions.
Echocardiography of OVE26 diabetic hearts reveals normal or hyperdynamic function under basal conditions but with a sharply reduced response to injection of a β-adrenergic agonist. The unimpaired basal echocardiography and absence of a strong stimulatory response suggest that OVE26 hearts are exhibiting a compensatory augmentation of contractility, perhaps as a result of heightened adrenergic tone in vivo.
We found that ROS production is elevated with either high glucose or AngII in diabetic myocytes. Superoxide detection with the mitochondrial sensor MitoSOX Red confirmed that mitochondria are a major source of excess ROS in diabetic myocytes. Future study will focus on mitochondrial ROS production: Why is ROS generation increased? What damage comes from mitochondrial ROS? And what mediates AngII-stimulated ROS generation in diabetic myocytes?
Acknowledgments:
This work was supported by NIH grants HL62892 and DK-73586 (to P.N.E).
References
- Jaffe AS, Spadaro JJ, Schechtman K, Roberts R, Geltman EM, Sobel BE. Increased congestive heart failure after myocardial infarction of modest extent in patients with diabetes mellitus. Am Heart J 1984. 108(1):31-37. [DOD] [CrossRef]
- Bonow RO, Gheorghiade M. The diabetes epidemic: a national and global crisis. Am J Med 2004. 116(Suppl 5A):2S-10S. [DOD] [CrossRef]
- Rubler S, Dlugash J, Yuceoglu YZ, Kumral T, Branwood AW, Grishman A. New type of cardiomyopathy associated with diabetic glomerulosclerosis. Am J Cardiol 1972. 30(6):595-602. [DOD] [CrossRef]
- Regan TJ, Lyons MM, Ahmed SS, Levinson GE, Oldewurtel HA, Ahmad MR, Haider B. Evidence for cardiomyopathy in familial diabetes mellitus. J Clin Invest 1977. 60(4):884-899. [DOD]
- Brown RA, Walsh MF, Ren J. Influence of gender and diabetes on vascular and myocardial contractile function. Endocr Res 2001. 27(4):399-408. [DOD] [CrossRef]
- Belke DD, Larsen TS, Gibbs EM, Severson DL. Altered metabolism causes cardiac dysfunction in perfused hearts from diabetic (db/db) mice. Am J Physiol Endocrinol Metab 2000. 279(5):E1104-E1113. [DOD]
- Wang J, Song Y, Wang Q, Kralik PM, Epstein PN. Causes and characteristics of diabetic cardiomyopathy. Rev Diabet Stud 2006. 3(3):108-117. [DOD] [CrossRef]
- Penckofer S, Schwertz D, Florczak K. Oxidative stress and cardiovascular disease in type 2 diabetes: the role of antioxidants and pro-oxidants. J Cardiovasc Nurs 2002. 16(2):68-85. [DOD]
- Cai L, Kang YJ. Oxidative stress and diabetic cardiomyopathy: a brief review. Cardiovasc Toxicol 2001. 1(3):181-193. [DOD] [CrossRef]
- Kristal BS, Jackson CT, Chung HY, Matsuda M, Nguyen HD, Yu BP. Defects at center P underlie diabetes-associated mitochondrial dysfunction. Free Radic Biol Med 1997. 22(5):823-833. [DOD] [CrossRef]
- Nishikawa T, Edelstein D, Du XL, Yamagishi S, Matsumura T, Kaneda Y, Yorek MA, Beebe D, Oates PJ, Hammes HP, Giardino I, Brownlee M. Normalizing mitochondrial superoxide production blocks three pathways of hyperglycaemic damage. Nature 2000. 404(6779):787-790. [DOD] [CrossRef]
- Du XL, Edelstein D, Brownlee M. Free fatty acids inhibit endothelial cell prostacyclin production and nitric oxide synthetase (eNOS) activity by inducing mitochondrial superoxide overproduction. Diabetes 2001. 50:A152. [DOD]
- Shirong Z, Noonan WT, Metreveli NS, Kralik PM, Carlson EC, Epstein PN. Diabetic Nephropathy in the OVE26 Mouse Model of Type I Diabetes. NIDDK Consortium on Diabetic Complications 2004. 1:53. [DOD]
- Ye G, Metreveli NS, Donthi RV, Xia S, Xu M, Carlson EC, Epstein PN. Catalase protects cardiomyocyte function in models of type 1 and type 2 diabetes. Diabetes 2004. 53(5):1336-1343. [DOD] [CrossRef]
- Shen X, Zheng S, Metreveli NS, Epstein PN. Protection of cardiac mitochondria by overexpression of MnSOD reduces diabetic cardiomyopathy. Diabetes 2006. 55(3):798-805. [DOD] [CrossRef]
- Shen X, Zheng S, Thongboonkerd V, Xu M, Pierce WM Jr, Klein JB, Epstein PN. Cardiac mitochondrial damage and biogenesis in a chronic model of type 1 diabetes. Am J Physiol Endocrinol Metab 2004. 287(5):E896-E905. [DOD] [CrossRef]
- Epstein PN, Overbeek PA, Means AR. Calmodulin-induced early-onset diabetes in transgenic mice. Cell 1989. 58(6):1067-1073. [DOD] [CrossRef]
- Kajstura J, Fiordaliso F, Andreoli AM, Li B, Chimenti S, Medow MS, Limana F, Nadal-Ginard B, Leri A, Anversa P. IGF-1 overexpression inhibits the development of diabetic cardiomyopathy and angiotensin II-mediated oxidative stress. Diabetes 2001. 50(6):1414-1424. [DOD] [CrossRef]
- Ren J, Sowers JR, Walsh MF, Brown RA. Reduced contractile response to insulin and IGF-I in ventricular myocytes from genetically obese Zucker rats. Am J Physiol Heart Circ Physiol 2000. 279(4):H1708-H1714. [DOD]
- Hoit BD. New approaches to phenotypic analysis in adult mice. J Mol Cell Cardiol 2001. 33(1):27-35. [DOD] [CrossRef]
- Srivastava S, Chandrasekar B, Gu Y, Luo J, Hamid T, Hill BG, Prabhu SD. Downregulation of CuZn-superoxide dismutase contributes to beta-adrenergic receptor-mediated oxidative stress in the heart. Cardiovasc Res 2007. 74(3):445-455. [DOD] [CrossRef]
- Black RG Jr, Guo Y, Ge ZD, Murphree SS, Prabhu SD, Jones WK, Bolli R, Auchampach JA. Gene dosage-dependent effects of cardiac-specific overexpression of the A3 adenosine receptor. Circ Res 2002. 91(2):165-172. [DOD] [CrossRef]
- Tanaka N, Dalton N, Mao L, Rockman HA, Peterson KL, Gottshall KR, Hunter JJ, Chien KR, Ross J Jr. Transthoracic echocardiography in models of cardiac disease in the mouse. Circulation 1996. 94(5):1109-1117. [DOD]
- Duan J, Zhang HY, Adkins SD, Ren BH, Norby FL, Zhang X, Benoit JN, Epstein PN, Ren J. Impaired cardiac function and IGF-I response in myocytes from calmodulin-diabetic mice: role of Akt and RhoA. Am J Physiol Endocrinol Metab 2003. 284(2):E366-E376. [DOD]
- Murakami Y, Zhang J, Eijgelshoven MH, Chen W, Carlyle WC, Zhang Y, Gong G, Bache RJ. Myocardial creatine kinase kinetics in hearts with postinfarction left ventricular remodeling. Am J Physiol 1999. 276(3 Pt 2):H892-H900. [DOD]
- Ye G, Metreveli NS, Ren J, Epstein PN. Metallothionein prevents diabetes-induced deficits in cardiomyocytes by inhibiting reactive oxygen species production. Diabetes 2003. 52(3):777-783. [DOD] [CrossRef]
- Dutta K, Podolin DA, Davidson MB, Davidoff AJ. Cardiomyocyte dysfunction in sucrose-fed rats is associated with insulin resistance. Diabetes 2001. 50(5):1186-1192. [DOD] [CrossRef]
- Brown RA, Filipovich P, Walsh MF, Sowers JR. Influence of sex, diabetes and ethanol on intrinsic contractile performance of isolated rat myocardium. Basic Res Cardiol 1996. 91(5):353-360. [DOD]
- Suarez J, Belke DD, Gloss B, Dieterle T, McDonough PM, Kim YK, Brunton LL, Dillmann WH. In vivo adenoviral transfer of sorcin reverses cardiac contractile abnormalities of diabetic cardiomyopathy. Am J Physiol Heart Circ Physiol 2004. 286(1):H68-H75. [DOD] [CrossRef]
- Tsutsui H, Matsushima S, Kinugawa S, Ide T, Inoue N, Ohta Y, Yokota T, Hamaguchi S, Sunagawa K. Angiotensin II type 1 receptor blocker attenuates myocardial remodeling and preserves diastolic function in diabetic heart. Hypertens Res 2007. 30(5):439-449. [DOD] [CrossRef]
- Shiomi T, Tsutsui H, Ikeuchi M, Matsusaka H, Hayashidani S, Suematsu N, Wen J, Kubota T, Takeshita A. Streptozotocin-induced hyperglycemia exacerbates left ventricular remodeling and failure after experimental myocardial infarction. J Am Coll Cardiol 2003. 42(1):165-172. [DOD] [CrossRef]
- Li Y, Gu Y, Song Y, Zhang L, Kang YJ, Prabhu SD, Cai L. Cardiac functional analysis by electrocardiography, echocardiography and in situ hemodynamics in streptozotocin-induced diabetic mice. J Health Sci 2004. 50(4):356-365. [DOD] [CrossRef]
- Wold LE, Ren J. Streptozotocin directly impairs cardiac contractile function in isolated ventricular myocytes via a p38 map kinase-dependent oxidative stress mechanism. Biochem Biophys Res Commun 2004. 318(4):1066-1071. [DOD] [CrossRef]
- Epstein PN, Ribar TJ, Decker GL, Yaney G, Means AR. Elevated beta-cell calmodulin produces a unique insulin secretory defect in transgenic mice. Endocrinology 1992. 130(3):1387-1393. [DOD] [CrossRef]
- Schaffer SW, Allo S, Punna S, White T. Defective response to cAMP-dependent protein kinase in non-insulin-dependent diabetic heart. Am J Physiol 1991. 261(3 Pt 1):E369-E376. [DOD]
- Smith JM, Paulson DJ, Romano FD. Inhibition of nitric oxide synthase by L-NAME improves ventricular performance in streptozotocin-diabetic rats. J Mol Cell Cardiol 1997. 29(9):2393-2402. [DOD] [CrossRef]
- Kardelen F, Akcurin G, Ertug H, Akcurin S, Bircan I. Heart rate variability and circadian variations in type 1 diabetes mellitus. Pediatr Diabetes 2006. 7(1):45-50. [DOD] [CrossRef]
- Pop-Busui R, Kirkwood I, Schmid H, Marinescu V, Schroeder J, Larkin D, Yamada E, Raffel DM, Stevens MJ. Sympathetic dysfunction in type 1 diabetes: association with impaired myocardial blood flow reserve and diastolic dysfunction. J Am Coll Cardiol 2004. 44(12):2368-2374. [DOD] [CrossRef]
- Ghosh S, Pulinilkunnil T, Yuen G, Kewalramani G, An D, Qi D, Abrahani A, Rodrigues B. Cardiomyocyte apoptosis induced by short-term diabetes requires mitochondrial GSH depletion. Am J Physiol Heart Circ Physiol 2005. 289(2):H768-H776. [DOD] [CrossRef]
- Zhang GX, Lu XM, Kimura S, Nishiyama A. Role of mitochondria in angiotensin II-induced reactive oxygen species and mitogen-activated protein kinase activation. Cardiovasc Res 2007. 76(2):204-212. [DOD] [CrossRef]
- Bendall JK, Cave AC, Heymes C, Gall N, Shah AM. Pivotal role of a gp91(phox)-containing NADPH oxidase in angiotensin II- induced cardiac hypertrophy in mice. Circulation 2002. 105(3):293-296. [DOD] [CrossRef]
- Nishio Y, Kashiwagi A, Taki H, Shinozaki K, Maeno Y, Kojima H, Maegawa H, Haneda M, Hidaka H, Yasuda H, Horiike K, Kikkawa R. Altered activities of transcription factors and their related gene expression in cardiac tissues of diabetic rats. Diabetes 1998. 47(8):1318-1325. [DOD] [CrossRef]
- Hink U, Li H, Mollnau H, Oelze M, Matheis E, Hartmann M, Skatchkov M, Thaiss F, Stahl RA, Warnholtz A, et al. Mechanisms underlying endothelial dysfunction in diabetes mellitus. Circ Res 2001. 88(2):E14-E22. [DOD]
This article has been cited by other articles:

|
Structural remodeling of vagal afferent innervation of aortic arch and nucleus ambiguus (NA) projections to cardiac ganglia in a transgenic mouse model of type 1 diabetes (OVE26)
Li L, Huang C, Ai J, Yan B, Gu H, Ma Z, Li AY, Xinyan S, Harden SW, Hatcher JT, Wurster RD, Cheng ZJ
J Comp Neurol 2010. 518(14):2771-2793
|
|

|
The sites and topology of mitochondrial superoxide production
Brand MD
Exp Gerontol 2010. 45(7-8):466-472
|
|

|
Alcohol dehydrogenase accentuates ethanol-induced myocardial dysfunction and mitochondrial damage in mice: role of mitochondrial death pathway
Guo R, Ren J
PLoS One 2010. 5(1):e8757
|
|

|
Impaired baroreflex control of renal sympathetic nerve activity in type 1 diabetic mice (OVE26)
Gu H, Zhang ZH, Epstein PN, Li L, Harden SW, Wurster RD, Cheng ZJ
Neuroscience 2009. 161(1):78-85
|
|

|
Metallothionein abrogates GTP cyclohydrolase I inhibition-induced cardiac contractile and morphological defects: role of mitochondrial biogenesis
Ceylan-Isik AF, Guo KK, Carlson EC, Privratsky JR, Liao SJ, Cai L, Chen AF, Ren J
Hypertension 2009. 53(6):1023-1031
|
|

|
Nrf2 is critical in defense against high glucose-induced oxidative damage in cardiomyocytes
He X, Kan H, Cai L, Ma Q
J Mol Cell Cardiol 2009. 46(1):47-58
|
|

|
The complexities of diabetic cardiomyopathy: lessons from patients and animal models
Harmancey R, Taegtmeyer H
Curr Diab Rep 2008. 8(3):243-248
|
|
|


)
)
)
)
)